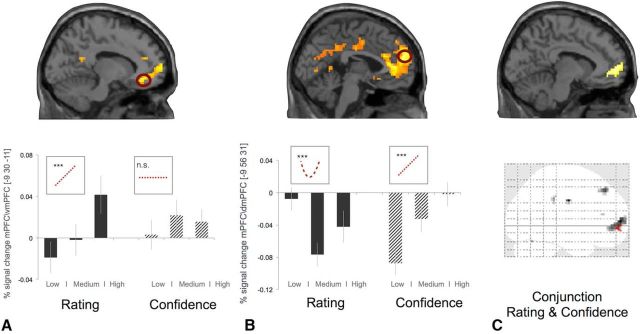
Figure 2.
A, BOLD signal in mPFC/vmPFC correlates with monotonic increase in liking ratings (peak= −9,38,−11 mm, z = 4.21, p < 0.05, FWE corrected at cluster level). For illustration purposes only, percentage signal change in vmPFC (8 mm sphere centered at the peak of the main effect −9,38,−11) for 3 levels or rating level and confidence (low, medium, and high) are shown; a linear relation between percentage signal changes and rating level and a nonsignificant (linear or quadratic) relation between percentage signal changes and confidence level. B, Activity in mPFC (extending in vmPFC and dmPFC) tracked monotonically the increases in confidence ratings (peak = −9,56,31, z = 4.55, p < 0.05, FWE corrected at cluster level). For illustration purposes only, percentage signal change in mPFC/dmPFC (8 mm sphere centered at the peak of the main effect −9, 56, 31) for 3 levels or rating and confidence (low, medium, and high) are shown; a linear relation between percentage signal change and confidence levels and a significant quadratic relation between percentage signal change and rating levels. The histogram plots are not used for statistical inference (which was performed in the SPM framework); they are shown solely to illustrate the dynamic of the BOLD signal. Error bars indicate SEM. SPM maps are thresholded at p < 0.005 uncorrected for display purposes. C, Conjunction analysis for rating and confidence: activity in mPFC/vmPFC (peak activation at −12,59,4, z = 3.61, p < 0.05, small volume corrected at peak level using at 8 mm centered at −2,52,−2 from Lebreton et al., 2015).

