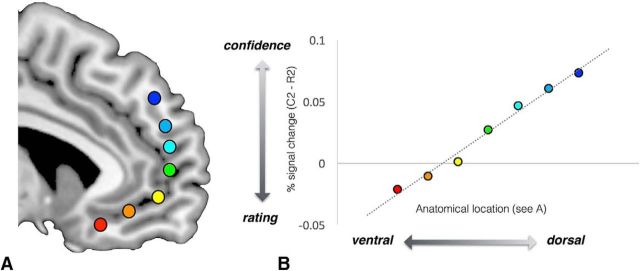
Figure 3.
Spatial gradient analysis along the ventral–dorsal axis of mPFC (see colored dots) for a contrast between the parametric response to rating and the parametric response to confidence (R2 − C2). Data from seven anatomical locations (A) are mapped onto a line and the spatial regression slope is computed (B). Across participants, there is a robust gradient along the medial lane of PFC with response to rating expressed in the more ventral part and response to confidence represented in in the more dorsal part.

