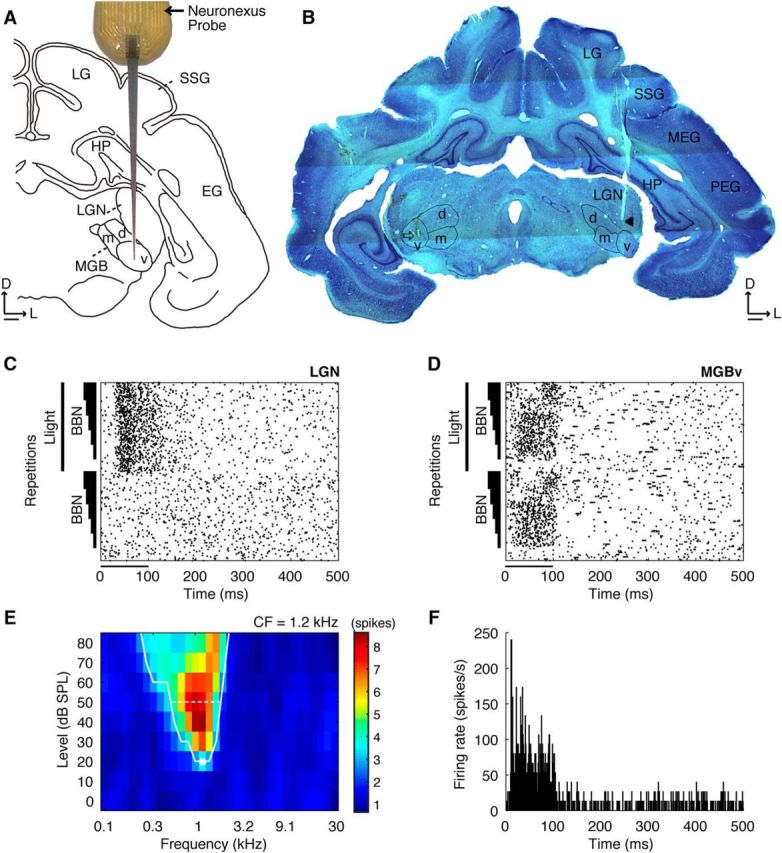
Figure 1.

Identification of the ventral division of MGB. A, Schematic of the recording probe (NeuroNexus; 16 recording sites, 100 μm apart) placed dorsoventrally through the cortex into LGN and MGB. B, Coronal section of the midbrain indicating the location of the electrode tracks (arrow in the left MGBv and arrowhead in the right LGN). C, D, Examples of responses to stimulation with broadband noise (BBN) alone or combined with light flashes from an amber LED in the visual (C) and auditory (D) thalamus. The lines parallel to the y-axis indicate the light stimulus, and the triangular bars represent the BBN stimuli increasing in amplitude from 50 to 90 dB SPL in 10 dB steps (20 repetitions). The stimulus duration is indicated by the horizontal bar beneath each plot starting at time 0. E, Example of a sharply tuned V-shaped FRA of multiunit activity recorded in MGBv. The white line indicates the tuning curve. CF is depicted by the white dot, and the white dashed line indicates the bandwidth at 30 dB above threshold. The color scale represents the number of spikes evoked at each frequency-level combination during the 100 ms stimulus. F, Example PSTH of responses to pure tones at unit CF in MGBv. D, Dorsal; d, dorsal MGB; EG, ectosylvian gyrus; HP, hippocampus; L, lateral; LG, lateral gyrus; m, medial MGB; MEG, middle ectosylvian gyrus; PEG, posterior ectosylvian gyrus; SSG, suprasylvian gyrus; v, ventral MGB. Scale bars: A, B, 1 mm.
