Figure 2.
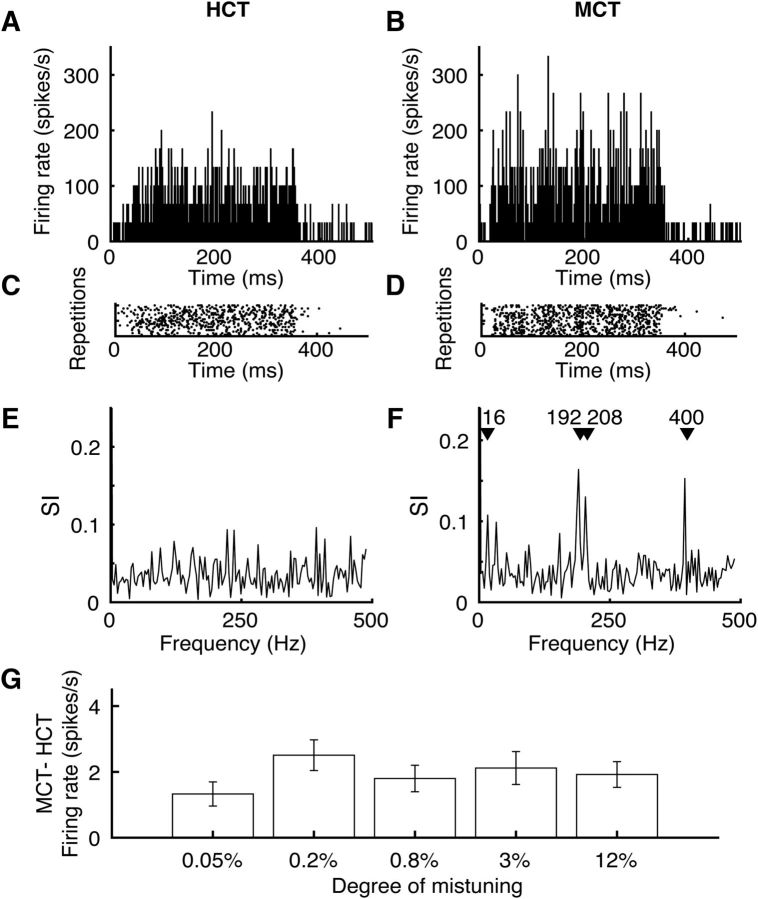
Responses to complex tones in MGBv. A, B, PSTHs showing the responses of one MGBv unit to 350 ms harmonic (A) and mistuned (B) complex tones. HCTs comprised 16 harmonics with a 400 Hz F0. In this example, for the MCT, the fourth harmonic was shifted by 192 Hz (12%). C, D, Raster plots corresponding to A and B, respectively. E, F, Temporal response patterns to HCTs (C) and MCTs (D) demonstrated using the SI. G, MCTs elicited higher firing rates than HCTs in MGBv units. Bars indicate the difference of firing rate from that evoked by the HCT (mean ± SEM) for each stimulus condition grouped by degree of mistuning (0.05%, 0.2%, 0.8%, 3% or 12%). Firing rate increased when MCTs were presented (repeated-measures ANOVA, F(5,290) = 7.4, p = 8.2 × 10⁻⁵), so long as the frequency of the mistuned harmonic fell within the FRA bandwidth of the unit at 30 dB above threshold.

