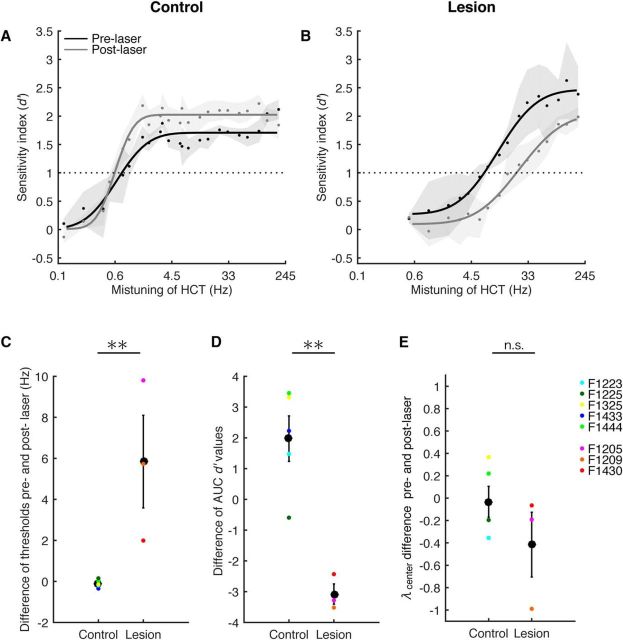
Figure 5.
Corticothalamic lesions impaired mistuning detection performance. A, B, Mean d′ (±SEM) values derived from the hit and false alarm rates of the control (A; n = 5) and lesion (B; n = 3) groups are plotted against the degree of mistuning (on a log scale) of a single-frequency component of an HCT. For each group, data are shown before laser illumination (pre-laser period, black) and >3 weeks after (post-laser period, gray). A cumulative Gaussian distribution was used to fit the psychometric functions (lines). Dots represent mean values across animals, and the shaded areas represent the SEM. The horizontal dashed lines indicate the threshold criterion of d′ = 1. C–E, Differences (mean ± SEM) between pre-laser and post-laser performance were computed for threshold (C), the AUC of the psychometric functions (D), and λcenter values (E). Colored dots represent data from individual animals. Significant differences between the control and lesion groups are indicated above the panels: **p < 0.01. n.s., Not significant.

