Figure 6.
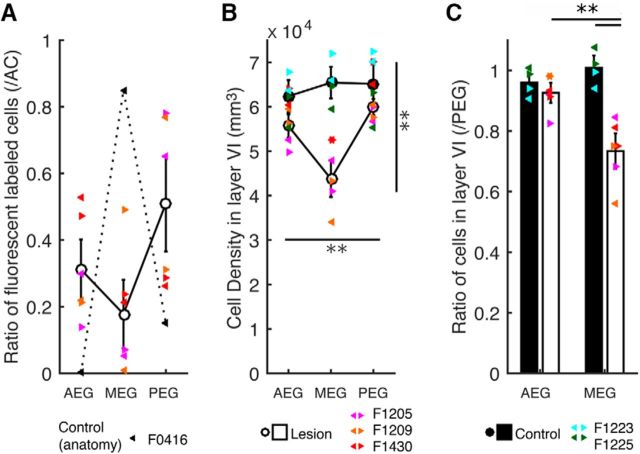
Corticothalamic cell loss after chromophore-targeted laser photolysis in the A1-MGBv pathway. A, The ratio of labeled cells in MEG (where A1 is located), PEG and AEG relative to the total number of labeled cells in the ectosylvian gyrus. White circles indicate the mean in the lesion animals. Black triangles represent values obtained from an anatomical control case in which BDA was injected into the MGBv. Different colors represent individual animals. The left and right pointing triangles indicate data from the left and right hemispheres, respectively. B, Cell density values in layer VI of MEG, PEG, and AEG. Black circles represent the mean in control cases, while white circles indicate the mean in lesion cases. Cell density in the lesion group was significantly different between different auditory cortical regions and from that in the control group (repeated-measures ANOVA: regions, F(2,6) = 8.9, p = 0.016; region × group, F(2,6) = 11.4, p = 0.009). C, Histograms of cell density ratio in MEG and AEG (relative to PEG; mean ± SEM) showed significantly lower cell density in the MEG in the lesion group than in the control group (Tukey–Kramer test, **p < 0.01).

