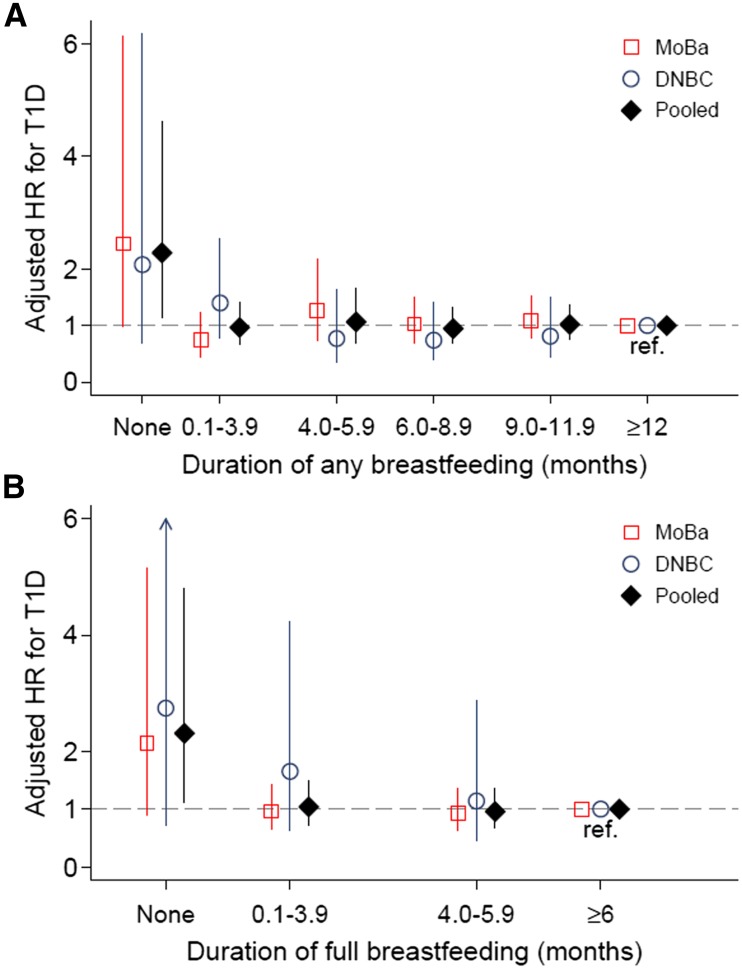
Figure 2.
Association of duration of any breastfeeding (A) and full breastfeeding (B) with risk of type 1 diabetes (T1D) in the MoBa and DNBC. The vertical lines show the 95% CIs. The upper confidence limit was 10.4 (arrow in panel B). HRs were adjusted for the following covariates: parental type 1 diabetes, infant sex, mode of delivery, infant birth weight, and gestational age at delivery, as well as the mother’s parity, age at delivery, education, smoking during pregnancy, and BMI before pregnancy. Exact numbers and incidence rates are shown in Supplementary Table 3. A total of 14 children had type 1 diabetes among those with no breastfeeding, reflecting the relatively wide CIs for this group. The pooled trend-adjusted HR per month difference in any breastfeeding was 0.99 (95% CI 0.97–1.01) overall and 0.99 (95% CI 0.97–1.01; P = 0.89) after excluding those not breastfed at all. The pooled trend-adjusted HR per month difference in full breastfeeding was 0.97 (95% CI 0.92–1.03) overall and 0.99 (95% CI 0.94–1.05; P = 0.73) after excluding those not breastfed at all.

