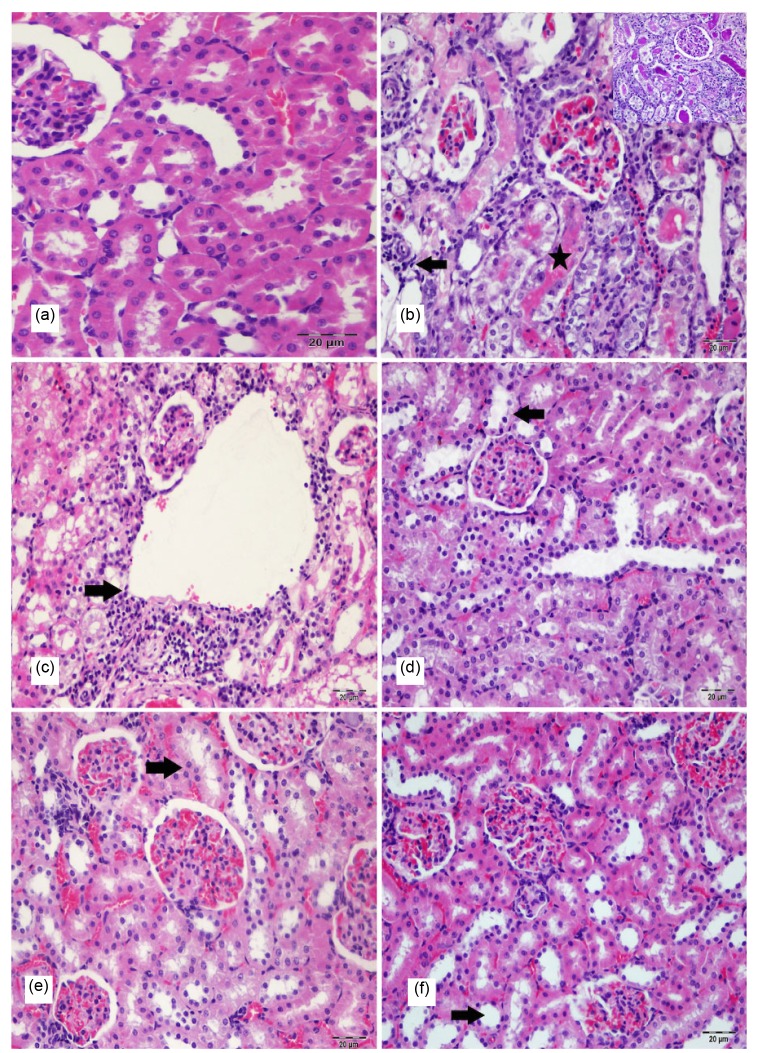
Fig. 1.
Histopathological appearance in H & E-PAS-stained rat kidney sections of all groups
(a) Normal kidney tissue (control group); (b) Severe tubulo epithelial degeneration, necrosis (star) and interstitial mononuclear cells infiltration (arrow) in kidney (Group IV); (c) Severe tubulo epithelial degeneration, necrosis and interstitial mononuclear cells infiltration (arrow) in kidney (Group VI); (d) Moderate tubulo epithelial degeneration (arrow) in kidney (Group V); (e) Moderate tubulo epithelial degeneration (arrow) in kidney (Group III); (f) Mild tubulo epithelial degeneration (arrow) in kidney (Group II). Bar: 20 μm

