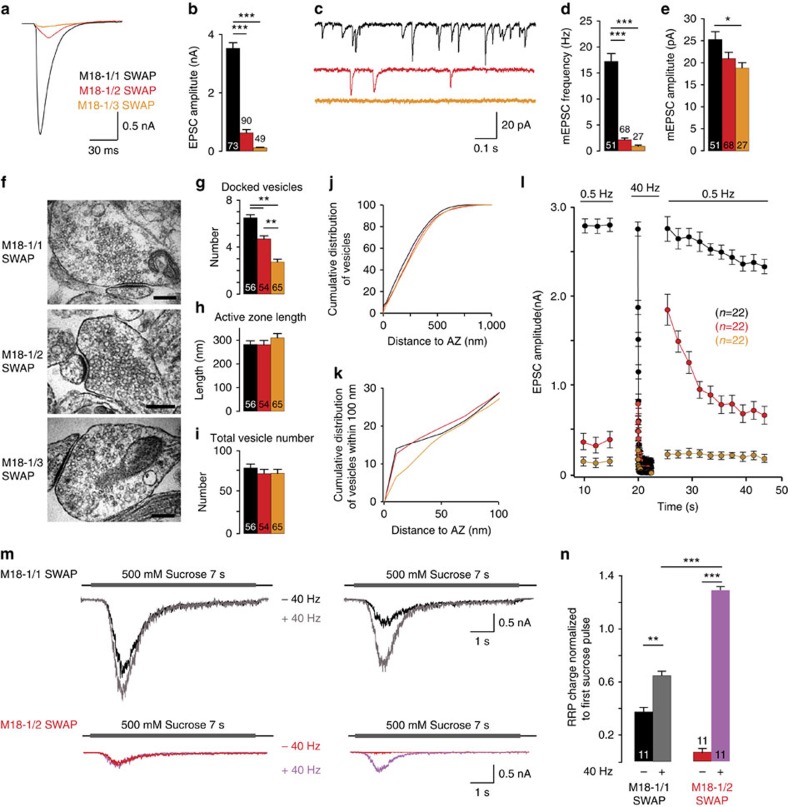
Figure 1. Replacing Munc18-1 with Munc18-2 but not Munc18-3 produces a munc13-1 null phenocopy.
(a,b) Sample traces and quantification of evoked EPSCs in naive munc18-1/1SWAP, munc18-1/2SWAP and munc18-1/3SWAP neurons. (c–e) Mini EPSCs sample traces (c), and quantification of frequency (d) and amplitudes (e). (f–k) Ultrastructural analysis of munc18-1/1SWAP, munc18-1/2SWAP and munc18-1/3SWAP asymmetric (glutamatergic) synapses: sample electron micrographs; scale bar,100 nm, (f) and quantification of docked vesicles (g), active zone length (h) and total vesicle number (i); cumulative plot of vesicle distance from the active zone (j) and a zoom of the first 100 nm (k). (l) Synaptic run down during 100AP at 40 Hz and transient potentiation of synaptic transmission in munc18-1/2SWAP, but not the other genotypes. (m,n) Assessment of activity-dependent priming using application of hypertonic sucrose to probe the readily releasable vesicle pool: sample traces (m) of munc18-1/2SWAP (red/blue) and control (munc18-1/1SWAP, black/grey) neurons stimulated with 500 mM sucrose twice with a 3 s interval with (grey/bleu) or without (black/red) 100AP at 40 Hz during this interval; (n) quantification of total charge generated by second hypertonic sucrose pulses, normalized to the first pulse. All data in this figure are means±s.e.m.; *P<0.05, **P<0.01, ***P<0.001 as determined by ANOVA. See Supplementary Table 1 for all values, s.e.m. and n-numbers plotted in this figure. ANOVA, analysis of variance.

