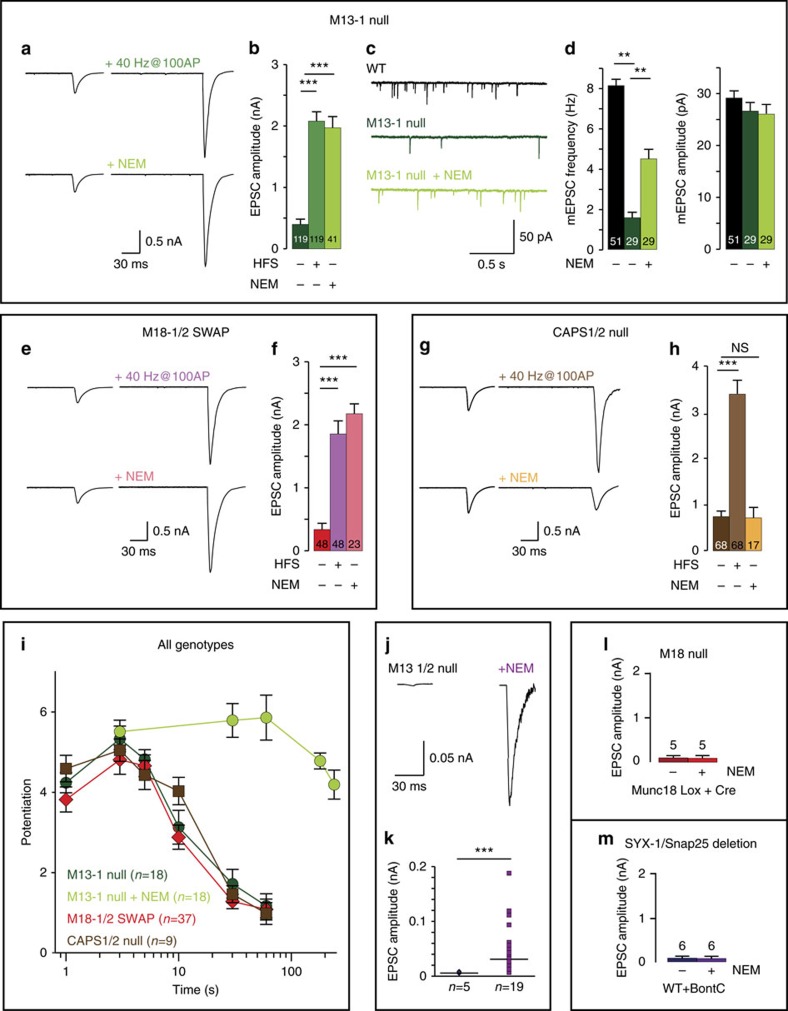
Figure 3. NSF-inhibition prevents de-priming and restores synaptic transmission in munc18-1/2SWAP and munc13-1 null.
(a,b) Sample traces and quantification of EPSCs potentiated by 100AP at 40 Hz or 10 s NEM application (100 μM) in munc13-1 null synapses. (c,d) mEPSCs sample traces and quantification of frequency and amplitude. (e,f) Sample traces and quantification of EPSCs potentiated by 100AP at 40 Hz or 10 s NEM application (100 μM) in munc18-1/2SWAP synapses. (g,h) Sample traces and quantification of EPSCs potentiated by 100AP at 40 Hz or 10 s NEM application (100 μM) in CAPS-1/2 null synapses. (i) Comparison of effectiveness between 100AP at 40 Hz or 10 s NEM application on potentiation of synaptic transmission in all genotypes. Data on 100AP at 40 Hz stimulation are copied from Fig. 2a for comparison. (j,k) Sample traces and quantification of EPSCs in munc13-1/2 null neurons with/without 10 s NEM application; (l) quantification of EPSCs in Cre-expressing munc18-1 lox neurons with and without NEM application. (m) Quantification of EPSCs in BoNT-C infected WT neurons with and without NEM application. All data in this figure are means±s.e.m. In b,d,f,h, *P<0.05, **P<0.01, ***P<0.001, are determined by ANOVA; in k, P values are determined by a binomial test. See Supplementary Table 1 for all values, s.e.m. and n-numbers plotted in this figure. ANOVA, analysis of variance.

