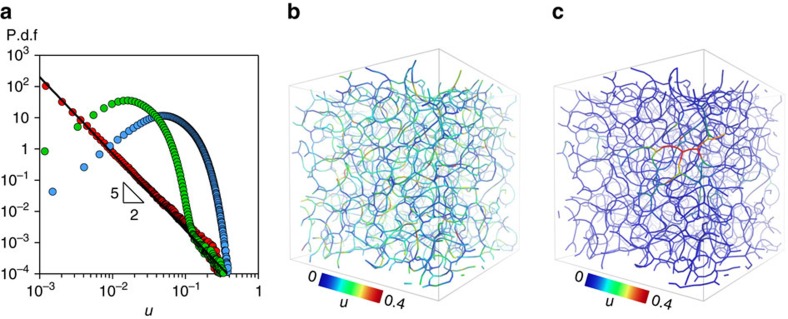
Figure 4. Microscopic particle displacements.
(a) The probability distribution function of the particle displacements calculated with a lag time equal to 40τ0 for three ratios of kBT/∈, blue circles represent the fully thermal regime kBT/∈ = 10−3, green circles refer to the intermediate regime kBT/∈ = 10−4 and red circles correspond to the configuration at kBT/∈ = 0, the solid black line represents the MF prediction u−5/2, a deviation from this purely elastic effects is seen when thermal fluctuations act on the small displacements. Snapshots of the colloidal gel network for kBT/∈ = 10−3 (b) and kBT/∈ = 0 (c), showing the interparticle bonds and the amplitude of the displacements after a rupture event.

