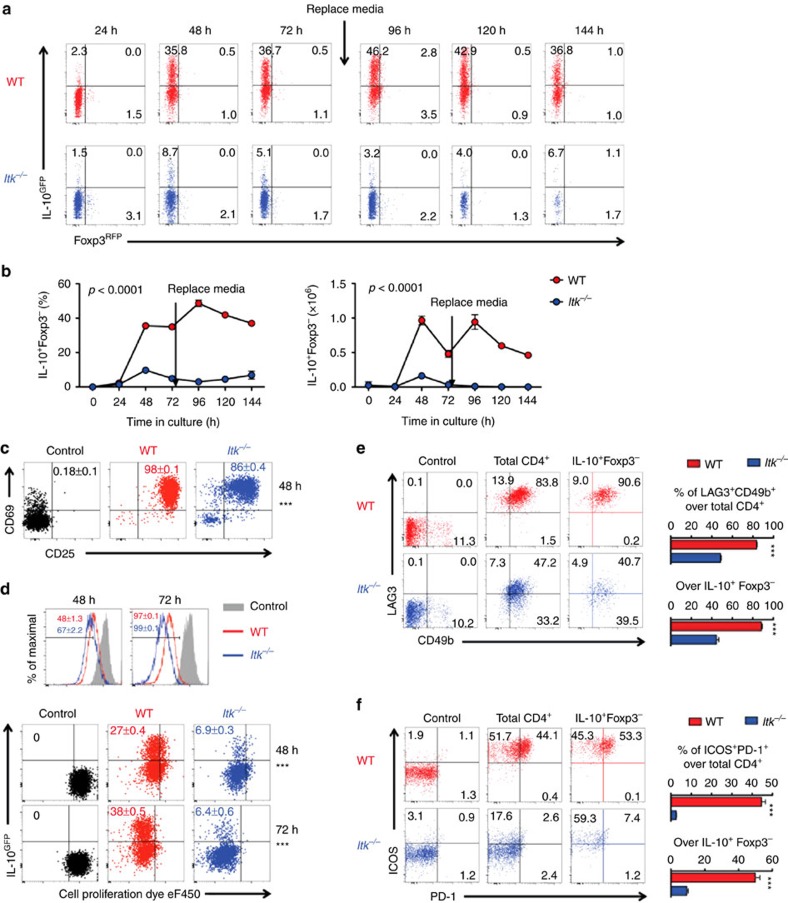
Figure 3. ITK is required for Tr1 cell differentiation in vitro.
All experiments were performed with cells carrying the IL-10GFP/Foxp3RFP dual reporter system for live cell analysis. Naive WT and Itk−/− CD4+ T cells were cultured under Tr1 polarizing condition. (a) Representative FACS plots showing the IL-10GFP and Foxp3RFP expression by naive CD4+ T cells cultured under Tr1 differentiation conditions for the indicated time. (b) Summary of IL-10+Foxp3− cell percentage and number (number per ml, initial naive CD4+ T cell density: 0.5 × 10⁶ per ml). p values calculated by two-way ANOVA. (c) Representative plots of CD25 and CD69 expression by naive CD4+ T cells cultured under Tr1 cell-differentiation conditions for 48 h. (d) Representative FACS plots showing the dilution of cell proliferation dye eF450 and expression of IL-10 by CD4+ T cells cultured under Tr1 differentiation conditions for 48 or 72 h. Mean±s.e.m. of six replicates were indicated on the flow cytometric plots. Representative plots and summary of percentages of double positive of (e) LAG3/CD49b and (f) ICOS/PD-1 expression by the total and IL-10+Foxp3− CD4+ T cells 72 h post culture. Naive CD4+ T cells were used as controls in c–f. n=6. Data represent results of more than three experiments. ***P≤0.001, by non-parametric Mann–Whitney test. Data presented as mean±s.e.m.

