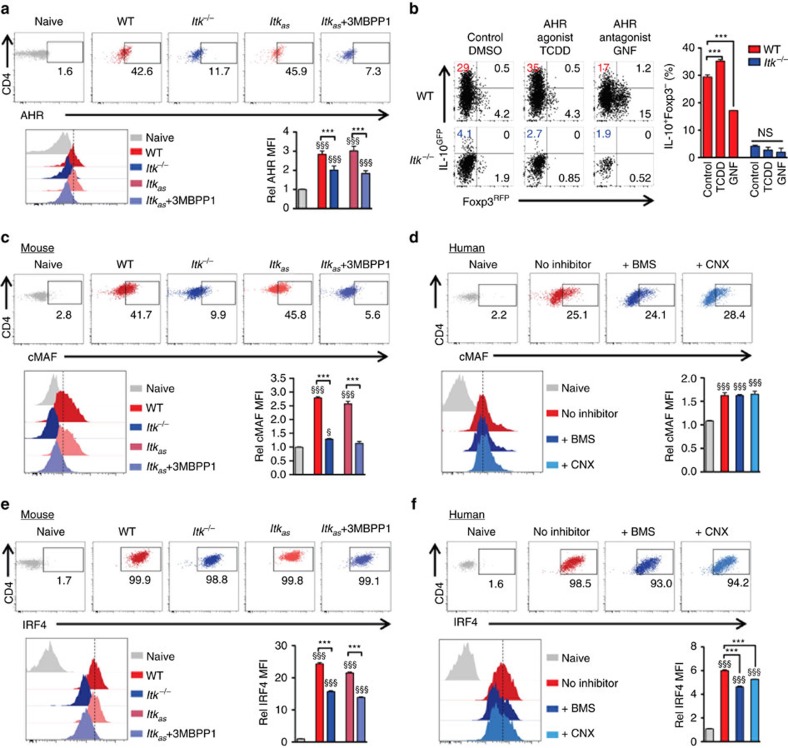
Figure 6. ITK regulates IRF4 expression during mouse and human Tr1 cell development.
(a) Representative FACS plots and summary of Rel MFI (naive cells level set as 1) of AHR expression in mouse cells cultured under Tr1 polarizing conditions. (b) Naive WT and Itk−/− IL-10GFP/Foxp3RFP reporter CD4+ T cells were cultured under Tr1 polarizing conditions; AHR agonist TCDD was added to activate AHR, and antagonist GNF was added to inhibit AHR activity. Representative FACS plots of IL-10GFP and Foxp3RFP expression, with summary of percentage of IL-10+Foxp3− cells are shown. (c,d) Representative FACS plots and summary of Rel MFI (naive cells level set as 1) of cMAF expression in (c) mouse and (d) human CD4+ T cells cultured under Tr1 polarizing conditions. (e,f) Representative FACS plots and summary of Rel MFI (naive cells level set as 1) of IRF4 expression in (e) mouse and (f) human CD4+ T cells cultured under Tr1 polarizing conditions. n=6; data represent results of three experiments in mouse. n=4; data represent results of two experiments in human. Naive CD4+ T cells without stimulation were used as control. §P≤0.05, §§§P≤0.001, compared with the control level; ***P≤0.001; NS, no significance, comparing groups connected, by Non-parametric Mann–Whitney test. Data presented as mean±s.e.m.

