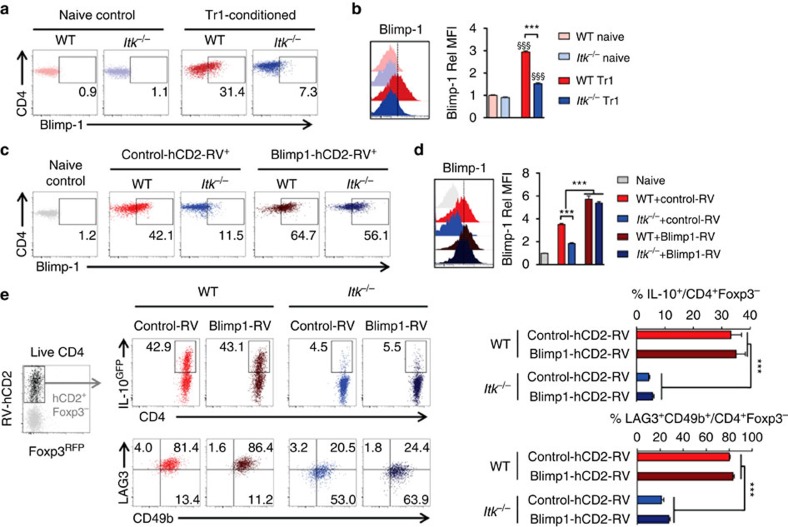
Figure 8. ITK regulates but does not depend on the expression of Blimp-1 during Tr1 cell differentiation.
(a,b) Representative FACS plots and summary of Rel MFI (WT naive cell level set as 1) of Blimp-1 expression in WT and Itk−/− naive CD4+ T cells or CD4+ T cells cultured under Tr1 cell-polarizing condition. n=6. Data represent results of two experiments. §§§P≤0.001, compared with the level in naive cells; ***P≤0.001, comparing groups connected, by Non-parametric Mann–Whitney test. (c–e) WT and Itk−/− naive IL-10GFP/Foxp3RFP reporter CD4+ cells were cultured under Tr1 polarizing condition, retrovirally transduced with control-hCD2 or Blimp-1-hCD2, and analyzed. (c) Representative FACS dot plots for the expression of Blimp-1 in RV transduced cells. (d) Histogram showing Blimp-1 signal intensity (left) and summary (right) of Rel Blimp-1 MFI. Naive CD4+ T cell population in grey was used as control. n=6. Data represent results of two experiments. ***P≤0.001, comparing groups connected, by Non-parametric Mann–Whitney test. (e) Representative FACS plots of (top) IL-10GFP expression in Foxp3−CD4+ T cells and summary of percentage of IL-10+ cells over live Foxp3−CD4+ T cells; (bottom) LAG3 and CD49b expression and summary of LAG3+CD49b+ Tr1 cells over live Foxp3−CD4+ T cells. n=4. Data represent results of three experiments. ***P≤0.001, by one-way ANOVA with Tukey’s post-hoc test. Data presented as mean±s.e.m.

