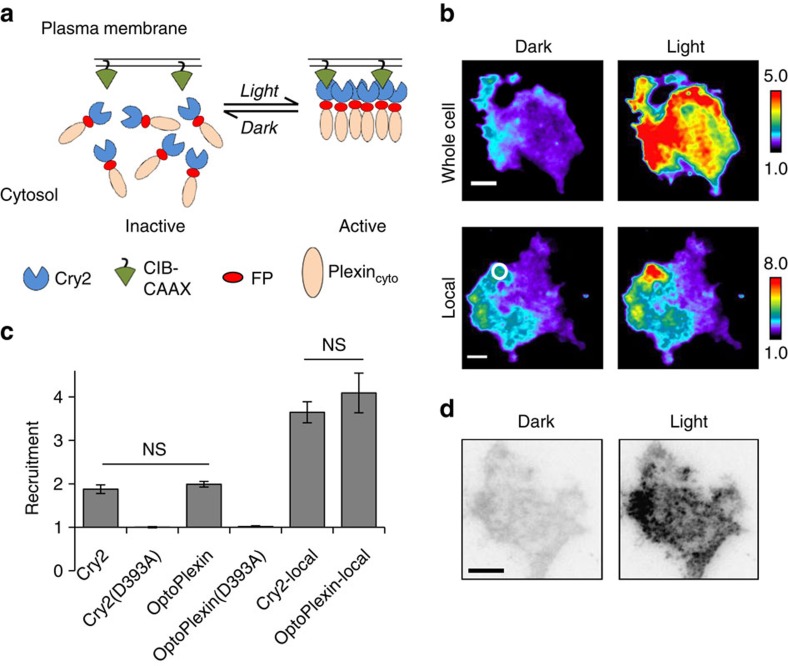
Figure 2. Design and characterization of optoPlexin.
(a) Cartoon representation of the optoPlexin design (see main text). FP, fluorescent protein; Plexincyto, cytosolic domain of Plexin-B1. (b) TIRF images showing the plasma membrane recruitment of mCherry-optoPlexin in COS-7 cells after 1 min of whole cell or local illumination (440 nm and 50 ms pulse at 0.1Hz, unless otherwise stated). Scale bar, 10 μm. White circle, region of illumination. (c) Quantification of the recruitment levels of Cry2, Cry2(D393A), optoPlexin and optoPlexin(D393A) on whole cell or localized blue light illumination in COS-7 cells. n=12–20, means±s.e.m. (d) TIRF images showing the clustering of mCherry-optoPlexin after one minute of whole-cell illumination in COS-7 cells. Scale bar, 10 μm. NS, not significant, Student’s t-test.

