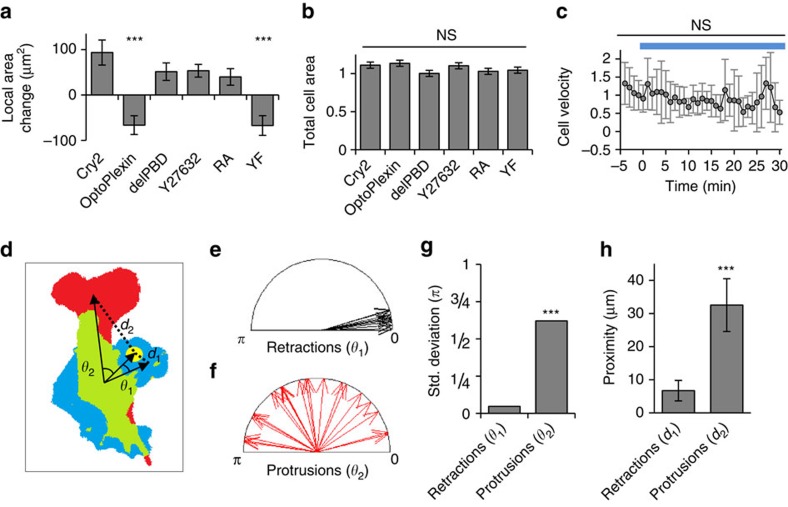
Figure 5. Effects of local activation of optoPlexin on cell morphology and motility.
Effects on the illuminated protrusions (a), measured in a 50 μm-diameter circle centred at the region of illumination, and total cell areas (b) after 7.5 min of local illumination in MC3T3-E1 cells expressing Cry2, optoPlexin, optoPlexin-delPBD, optoPlexin and pretreated with 10 μM Y-27632 ROCK inhibitor, and optoPlexin-RA, n=9–14 cells. (c) Cell centroid velocities at different times upon local activation of optoPlexin in MC3T3-E1 cells. Blue line, illumination at 440 nm, n=21 cells. (d) The locally induced retraction (blue) and the distal protrusion (red) after pulses of illumination (yellow) of an optoPlexin-expressing cell was illustrated in a morphology diagram. The overlapping cell area before and after illumination was labeled in green. Based on the centroids of these colour-coded regions, θ1 and θ2 were used to describe the angles of retraction and protrusion relative to the direction from the centroid of the cell at time 0 to the centre of illumination, respectively. Similarly, d1 and d2 indicated their centroid distances to the region of illumination, respectively. (e,f) Angles of retraction and protrusion induced by local activation of optoPlexin in MC3T3-E1 cells and (g) s.d. of their distribution, n=14 cells. (h) Proximity of retractions and protrusions induced by local activation of optoPlexin in MC3T3-E1 cells to the region of illumination, n=14 cells. For a,b,c,h, means±s.e.m are shown, ***P<0.001 and *P<0.05, NS, not significant, Student’s t-test. For g, ***P<0.001 and *P<0.05, NS, not significant, F-test.

