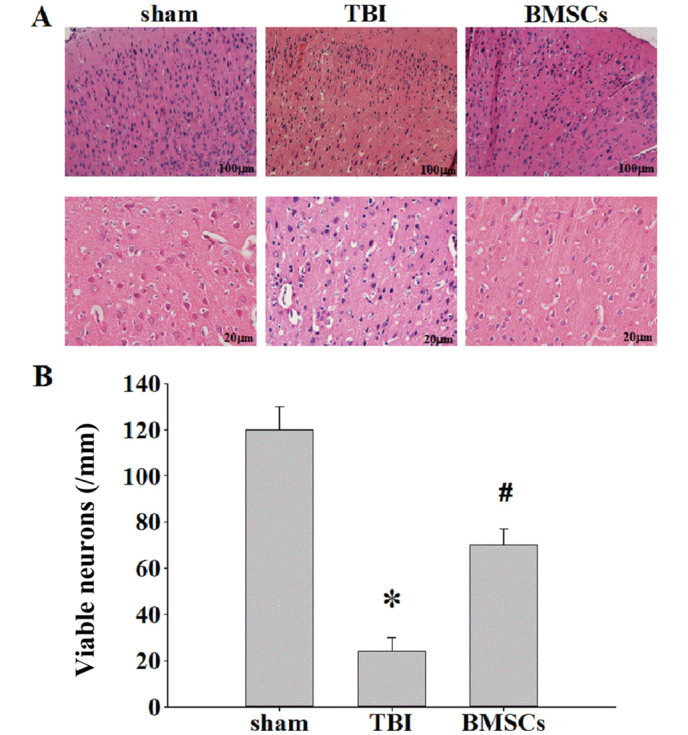
Figure 3.

Effect of BMSCs on cortex neuronal damage assessed via hematoxylin and eosin staining. (A) Representative staining in ipsilateral cerebral cortex areas of sham, TBI and BMSCs treatment groups at 7 days following TBI. Scale bar, 100 and 20 µm. (B) Quantification of the number of viable neurons/mm hippocampal area in each group. Data are expressed as the mean ± standard deviation (n=5/per group). *P<0.01 vs. sham group; #P<0.05 vs. TBI group. TBI, traumatic brain injury; BMSCs, bone marrow stromal cells.
