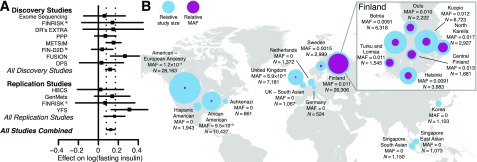
Figure 1.
AKT2 Pro50Thr association with FI levels. A: For each study, the square represents the estimate of the additive genetic effect for the association of the AKT2 Pro50Thr allele with log-transformed FI levels and the horizontal line gives the corresponding 95% CI of the estimate. Inverse-variance meta-analyses were performed for all discovery studies, all replication studies, and all studies combined. The vertical dashed lines indicate the 95% CI for the estimate obtained in the meta-analysis of all studies combined. DPS, The Finnish Diabetes Prevention Study; DR’s EXTRA, Dose-Responses to Exercise Training study; FIN-D2D, National Diabetes Prevention Programme in Finland; PPP, Prevalence, Prediction and Prevention of Diabetes (PPP)-Botnia study. B: MAF for each available region and ancestry. Across countries of the world, the MAF ranges from 0 to 1.1%. The relative sample sizes (N) for each region/ancestry are displayed with the blue circles and the relative MAFs of AKT2 Pro50Thr are displayed with the purple circles, with the size of the circles showing comparative differences. Within Finland (inset), where the MAF ranges from 0.9 to 1.7%, birthplace and study center data were used to show the allele distribution across the country. aFINRISK 2007, bFIN-D2D 2007, cFINRISK 1997 and 2002.

