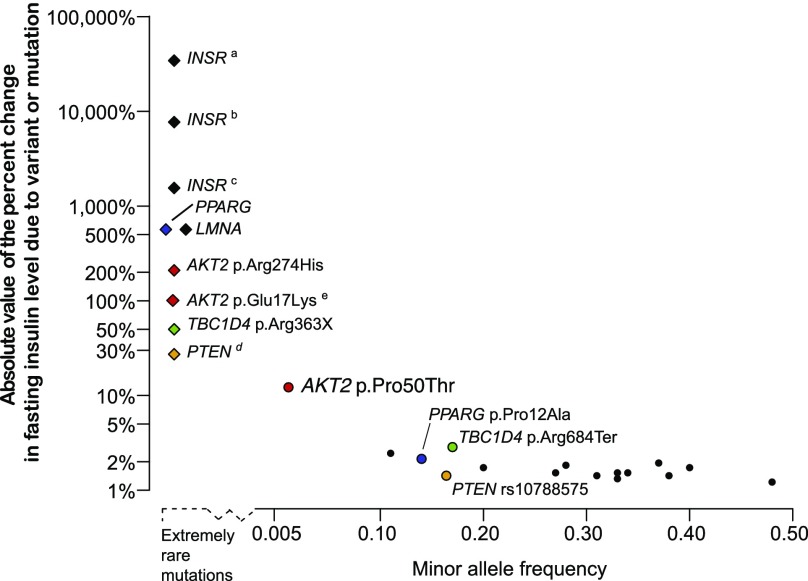
Figure 4.
Genetic architecture of rare, low-frequency, and common variants associated with FI levels. In this plot, the absolute values of the percent change in FI level due to rare monogenic mutations (diamonds) and common genetic variants (circles) are plotted against the MAF of the variant. The extremely rare monogenic mutations (above the dashed line to the left of the x-axis) were observed in 2–18 individuals (3,37–40,48,53,54), with the height of the point indicating the percent change in FI levels of mutation carriers from 40 pmol/L, an estimate of population mean FI level. Mutations in INSR and AKT2 p.Arg274His cause compensatory hyperinsulinemia, individuals with TBC1D4 p.Arg363Ter show normal FI levels but postprandial hyperinsulinemia, and mutations in PTEN cause enhanced insulin sensitivity providing protection against type 2 diabetes. For common variants, the percent change in FI levels per insulin-increasing allele is plotted above the solid horizontal axis. These observations are from sequencing (6) and array-based genome-wide association studies (3). For several genes, the effects from rare mutations can be compared with the effects of common variants in or near the gene: PPARG (blue), TBC1D4 (green), PTEN (orange), and AKT2 (red). aDonohue syndrome: biallelic LoF mutations in INSR (54). bRabson-Mendenhall syndrome: biallelic LoF mutations in INSR (54). cPostpubertal severe insulin resistance: heterozygous or homozygous LoF mutations in INSR (54). dLoF PTEN mutations cause Cowden syndrome in which carriers exhibit a lowered FI level (mean 29 pmol/L) compared with matched control subjects (3). eCarriers with the AKT2 p.Glu17Lys mutation were described with hypoinsulinemic hypoketotic hypoglycemia and hemihypertrophy with undetectable serum insulin (37,38).

