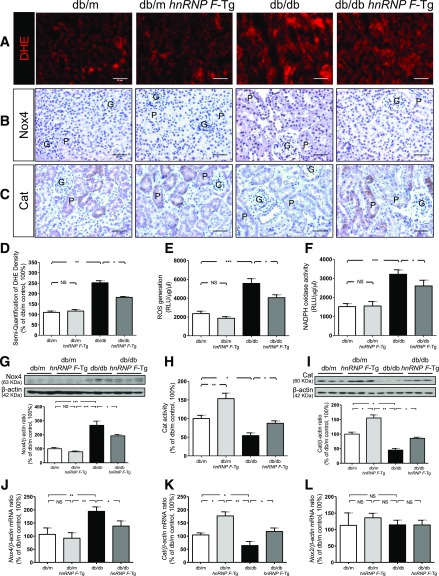
Figure 2.
ROS generation, NADPH oxidase and Cat activity, and Nox4 and Cat expression in mouse RPTs at age 20 weeks. DHE (red) staining (A) and Nox4 (B) and Cat (C) immunostaining in kidney sections (original magnification ×200) from db/m, db/m hnRNP F–Tg, db/db, and db/db hnRNP F–Tg mice. G, glomerulus; P, proximal tubule. Scale bars = 50 μm. Semiquantification of DHE fluorescence (D), ROS production (E), NADPH oxidase activity (F), WB of Nox4 (G), Cat activity (H), WB of Cat (I), real-time qPCR of Nox4 mRNA (J), Cat mRNA (K), and Nox2 mRNA (L) in freshly isolated RPTs from db/m, db/m hnRNP F–Tg, db/db, and db/db hnRNP F–Tg mice. Values are means ± SEM, n = 6. *P < 0.05; **P < 0.01; ***P < 0.005; NS, not significant.

