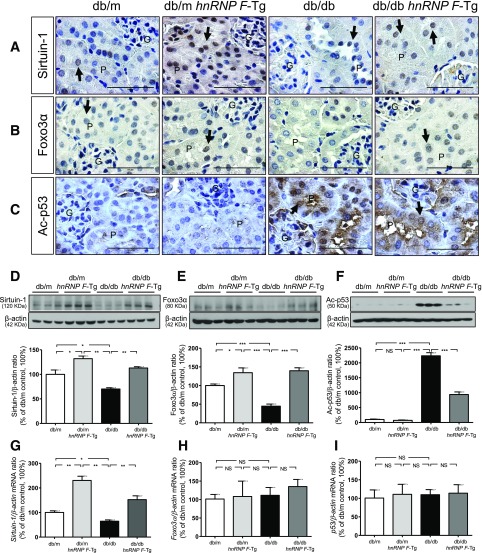
Figure 5.
Sirtuin-1, Foxo3α, and Ac-p53 expression in mouse kidneys at age 20 weeks. Immunohistochemical staining of Sirtuin-1 (A), Foxo3α (B), and Ac-p53 (C) in kidney sections from db/m, db/m hnRNP F–Tg, db/db, and db/db hnRNP F–Tg mice. Original magnification ×600. G, glomerulus; P, proximal tubule. The arrows indicate the immunostained nuclei. Scale bars = 50 μm. WB of Sirtuin-1 (D), Foxo3α (E), and Ac-p53 (F). Real-time qPCR of mRNA for Sirtuin-1 (G), Foxo3α (H), and p53 (I) in freshly isolated RPTs from db/m, db/m hnRNP F–Tg, db/db, and db/db hnRNP F–Tg mice. Values are means ± SEM, n = 6. *P < 0.05; **P < 0.01; ***P < 0.005. NS, not significant.

