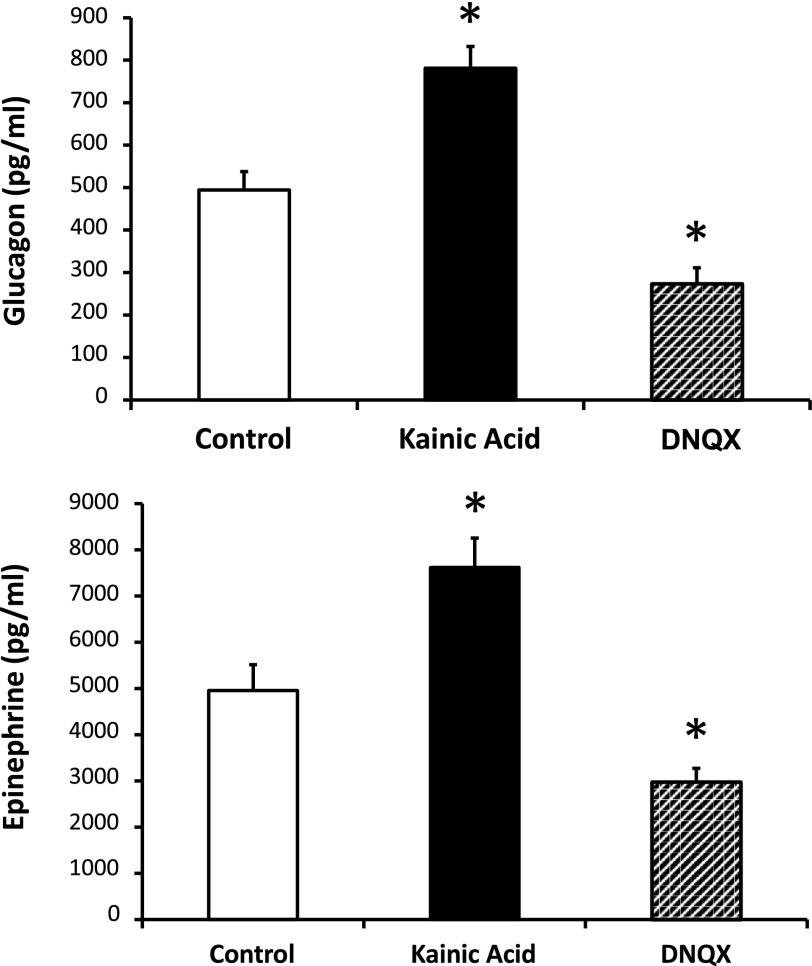
Figure 3.
Counterregulatory hormone responses to a hypoglycemic clamp. Peak plasma glucagon (top panel) and epinephrine (bottom panel) responses from hypoglycemia-naive animals microinjected with aECF (controls, n = 6), kainic acid (n = 6), or DNQX (n = 6) during the hypoglycemic clamp. Data are mean ± SEM. *P < 0.05 vs. control.

