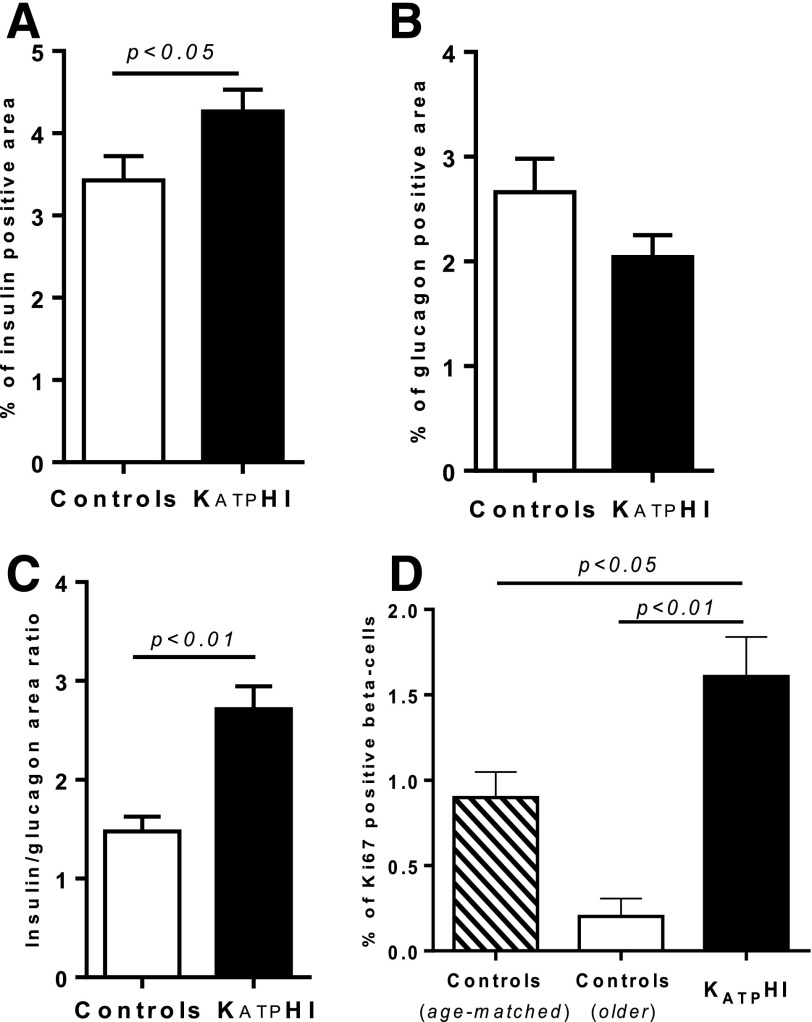
Figure 5.
β/α-Cell mass and β-cell proliferation in pancreas from KATPHI and control infants. Pancreatic tissue slides were obtained from KATPHI, age-matched autopsy or surgical control subjects and older control subjects and immunolabeled for insulin, glucagon, and Ki67. A: β-Cell area as the percentage of the total pancreatic area containing islet cells positive for insulin among all cells in the slide in KATPHI (n = 40) and age-matched control (n = 29) subjects. B: α-Cell area as the percentage of the total pancreatic area containing islet cells positive for glucagon among all cells in the slide in KATPHI (n = 40) and age-matched control (n = 29) subjects. C: Ratio of β-cell to α-cell area in KATPHI (n = 40) and age-matched control (n = 29) subjects. D: Percentage of Ki67-positive cells among insulin-positive cells in KATPHI (n = 40), older control pancreata (n = 5), and age-matched control pancreata (n = 29).

