Figure 3.
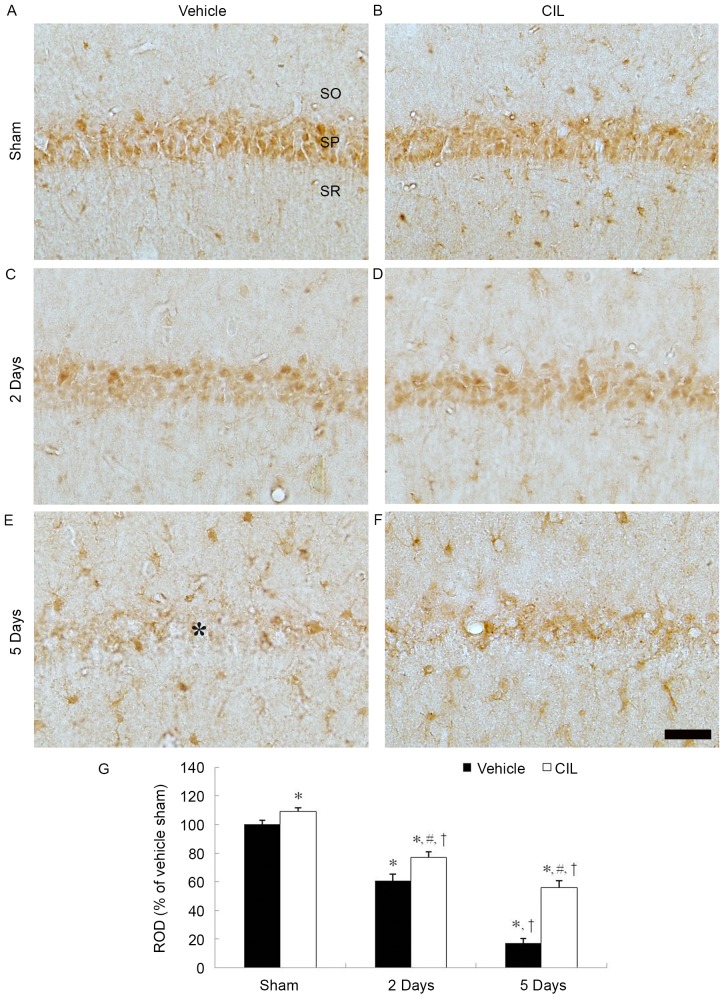
CAT immunohistochemistry in the hippocampal CA1 region of the (A) vehicle-sham, (B) CIL-sham-, (C and E) vehicle-ischemia- and (D and F) CIL-ischemia-groups following ischemia-reperfusion. CAT immunoreactivity is markedly decreased in the SP (asterisk) of the vehicle-ischemia-group at 5 days following ischemia-reperfusion; however, in the CIL-sham- and CIL-ischemia-groups, CAT immunoreactivity in the SP is significantly higher compared with the vehicle-sham- and vehicle-ischemia-groups. Scale bar, 100 µm. (G) ROD as % values of CAT immunoreactivity in the SP of each group (*P<0.05 vs. vehicle-sham-group; #P<0.05 vs. corresponding vehicle-ischemia-group; †P<0.05 vs. respective pre-time point group). The bars indicate the means ± standard error of mean. SP, stratum pyramidale; CAT, catalase; CIL, Chrysanthemum indicum Linné extract; ROD, relative optical density; SO, stratum oriens; SR, stratum radiatum.

