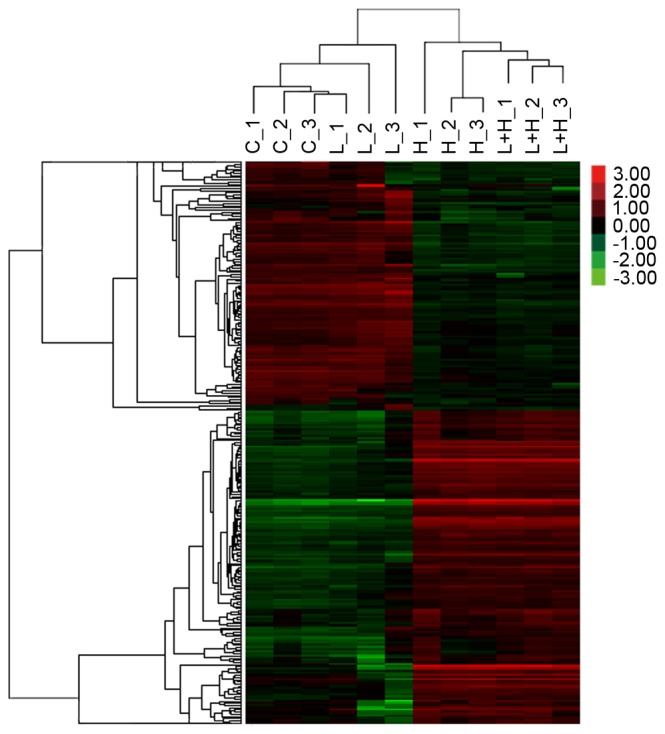
Figure 1.

Array data. Hierarchical clustering dendrogram comparing leptin-altered, hypoxia-altered, and leptin and hypoxia-treated groups to normoxia control exposure. Each sample listed contains the average gene expression value for three replicates. C, normoxia control; L, leptin 200 ng/ml; H, hypoxia, 1% O2; L+H, leptin and hypoxia (200 ng/ml leptin and 1% O2). Green, low expression; red, high expression.
