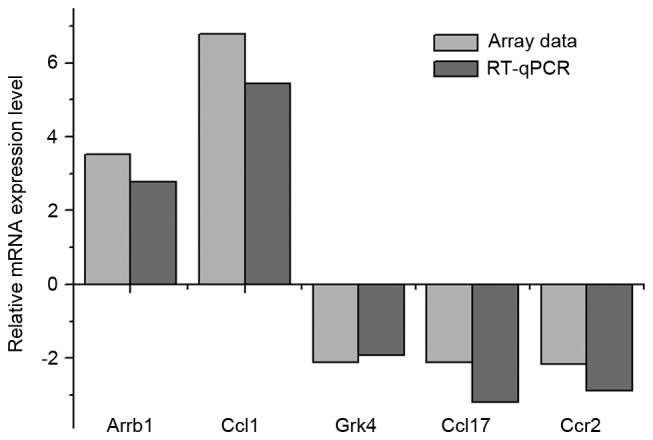
Figure 2.

RT-qPCR verification of the array data. Fold changes of selected genes in normoxia and hypoxia groups using microarray and RT-qPCR analyses. RT-qPCR, reverse transcription-quantitative polymerase chain reaction; Arrb1, Arrestin β1; Ccl1, C-C motif ligand 1, Grk4, G protein-coupled receptor kinase 4; Ccl17, C-C motif ligand 17; Ccr2, C-C motif chemokine receptor 2.
