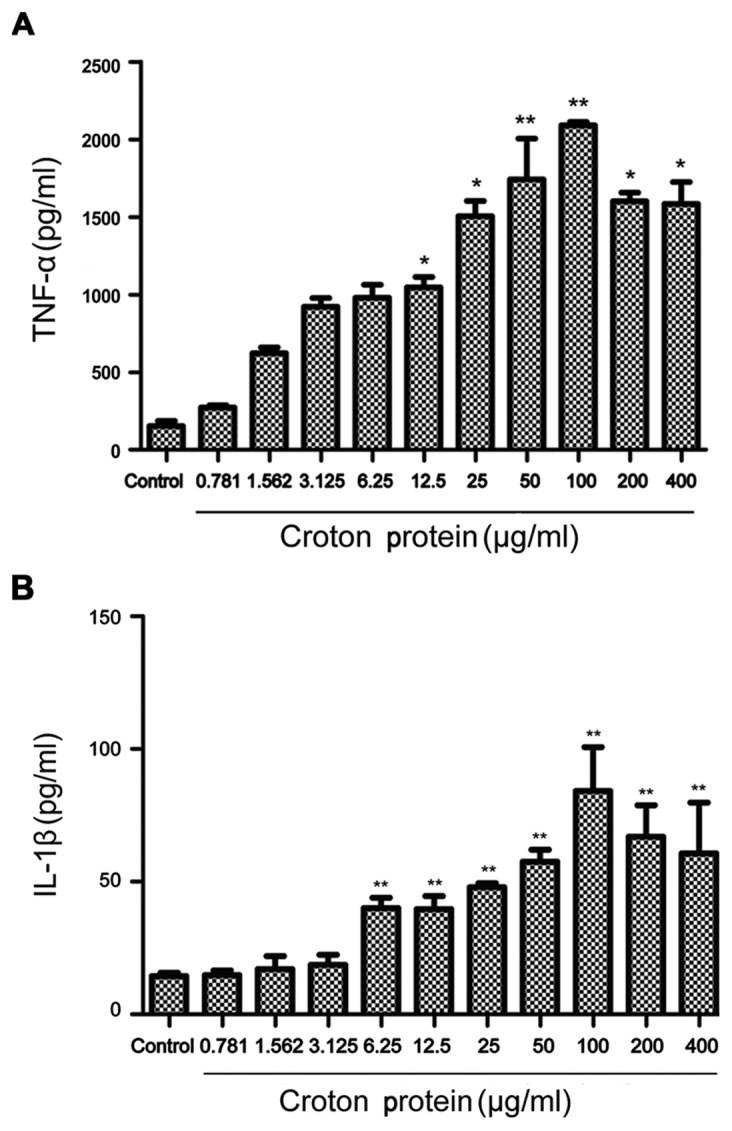
Figure 5.

Evaluation of cytokine levels following treatment with crude protein. (A) TNF-α levels following treatment with crude protein. (Β) IL-1β levels following treatment with crude protein. *P<0.05, **P<0.01 vs. control. ΤΝF, tumor necrosis factor; IL, interleukin.
