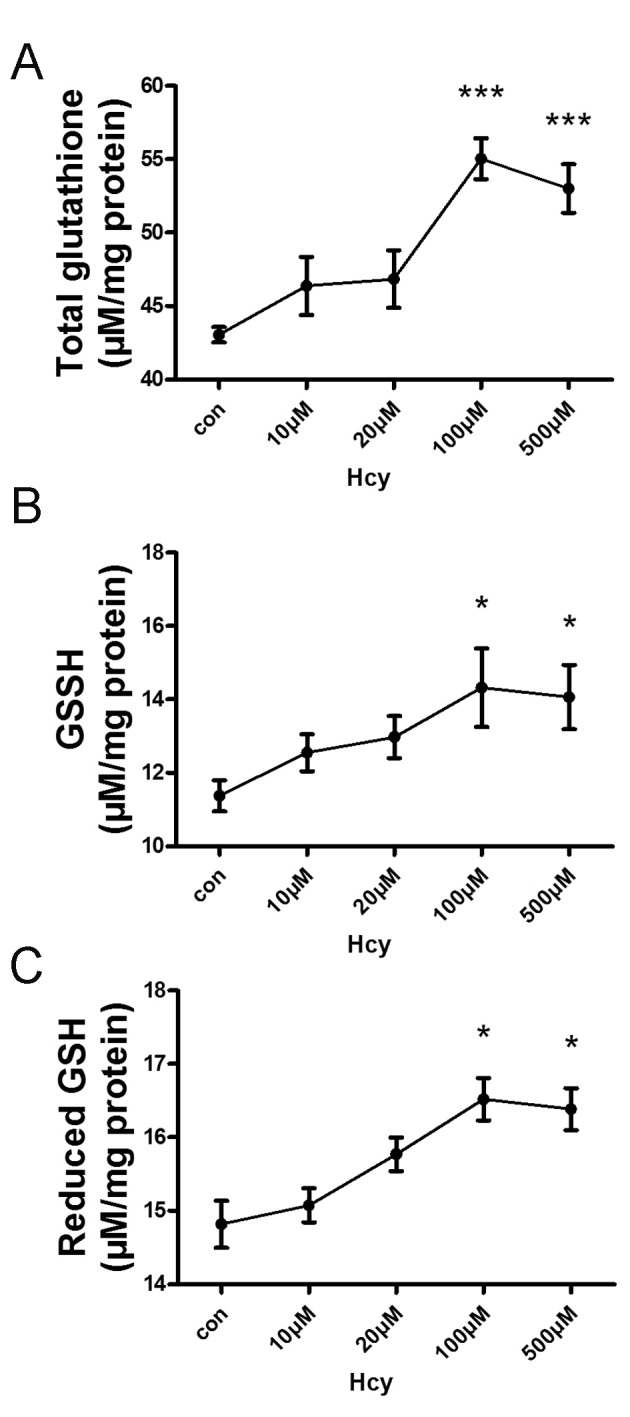
Figure 1.

GSH levels in response to Hcy treatment in HepG2 cells. HepG2 cells were treated with Hcy (0–500 µM) for 24 h. The levels of (A) total GSH, (B) oxidized GSH and (C) reduced GSH were determined using a GSH Assay kit. Values are presented as the mean ± standard error of the mean (n=3). *P<0.05, ***P<0.001; GSH, total glutathione; Hcy, homocysteine.
