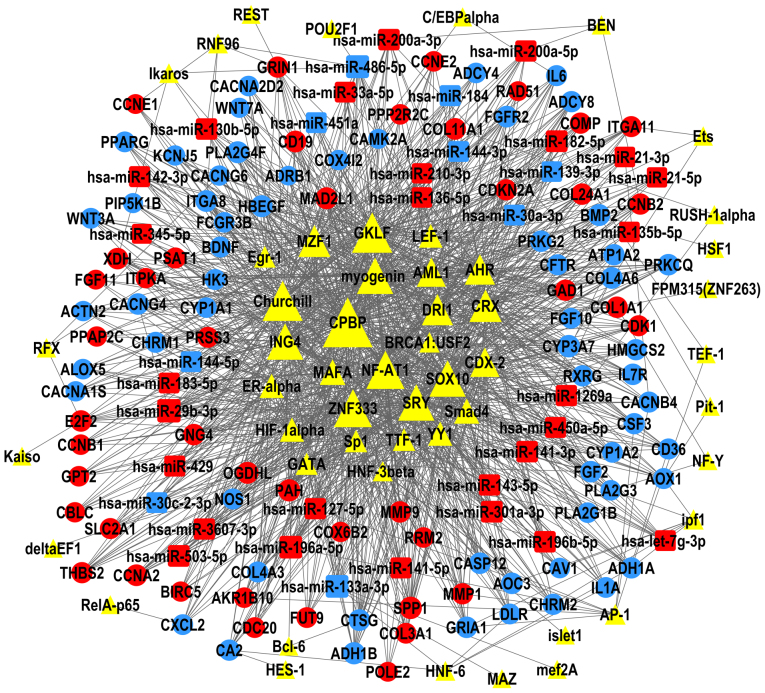
Figure 6.
TF-microRNA-gene network in LUAD. The regulatory network of TFs (triangles), DEMs (squares) and DEGs (circles); the size of each shape represents the number of closely interacting factors, with the large shapes indicating a higher number of interactions. Red represents upregulated expression in LUAD; blue represents downregulated expression; and yellow is uncertain. Lines denote the regulatory links among these factors. DEG, differential expressed genes; DEM, differential expressed miRNAs; LUAD, lung adenocarcinoma; TF, transcription factor.

