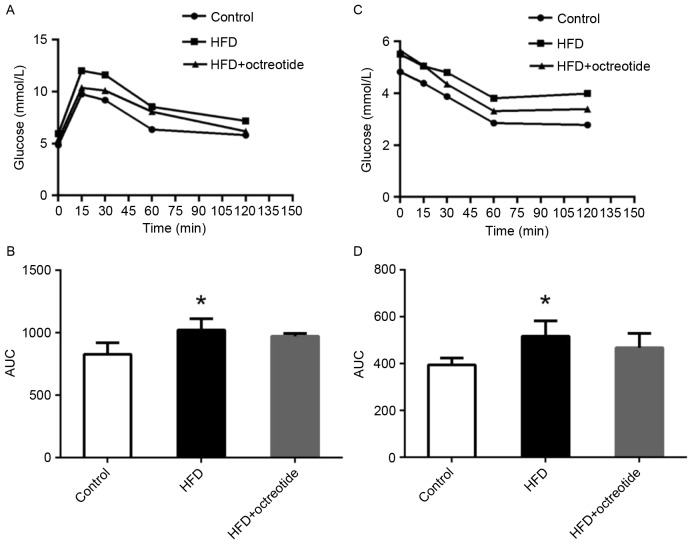
Figure 1.
Effect of octreotide on insulin resistance in rats with HFD-induced obesity. (A) The glycemic curve during the ipGTT and (B) the AUC of ipGTT. (C) The glycemic curve during the ipITT and (D) the AUC of ipGTT. Data are presented as the mean ± standard deviation of three independent experiments. *P<0.05 vs. control group. HFD, high fat diet; ipGTT, intraperitoneal glucose tolerance test; ipITT, intraperitoneal insulin tolerance test; AUC, area under the curve.

