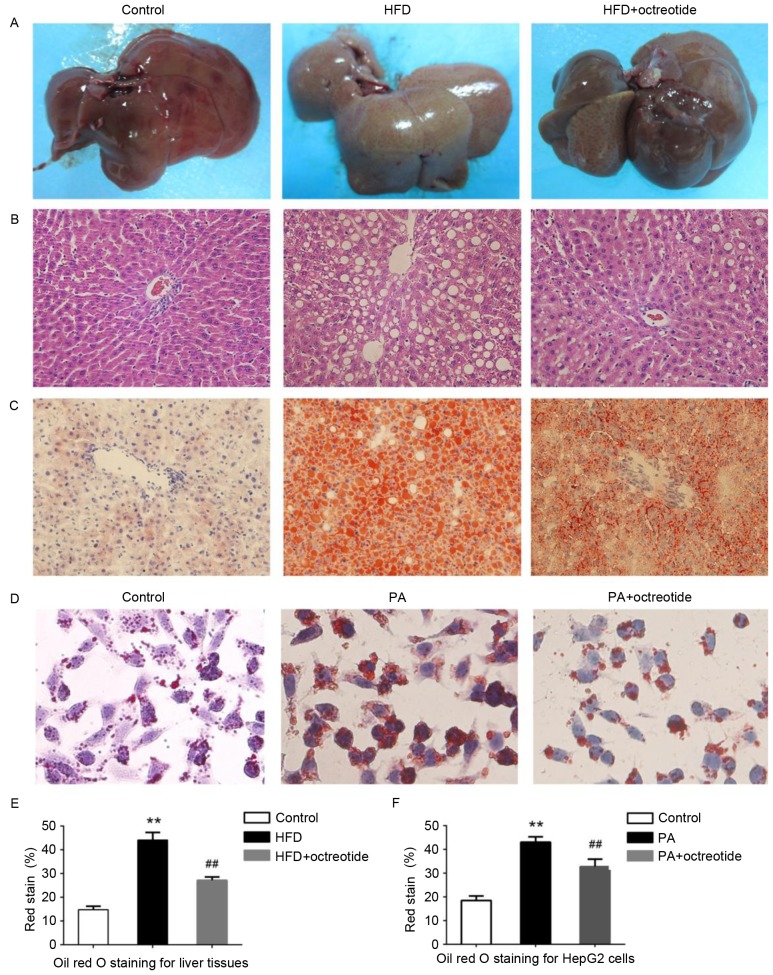
Figure 2.
Effect of octreotide on HFD-induced hepatic steatosis in obese rats and on PA-induced hepatocyte lipid accumulation in HepG2 cells. (A) Appearance of rat livers in each experimental group. Hepatic steatosis was evaluated by (B) hematoxylin and eosin staining of the paraffin-embedded liver tissue sections (magnification, ×400), and by (C) Oil Red O staining of frozen liver tissue sections (magnification, ×400). (D) Lipid accumulation in HepG2 cells was assessed by Oil Red O staining (magnification, ×400). The IOD values of Oil Red O staining in the (E) liver of rats and (F) in HepG2 cells. Data are presented as the mean ± standard deviation of three independent experiments. **P<0.01 vs. the control group; ##P<0.01 vs. the HFD group or the PA group. HFD, high fat diet; PA, palmitate; IOD, integrated optical density.

