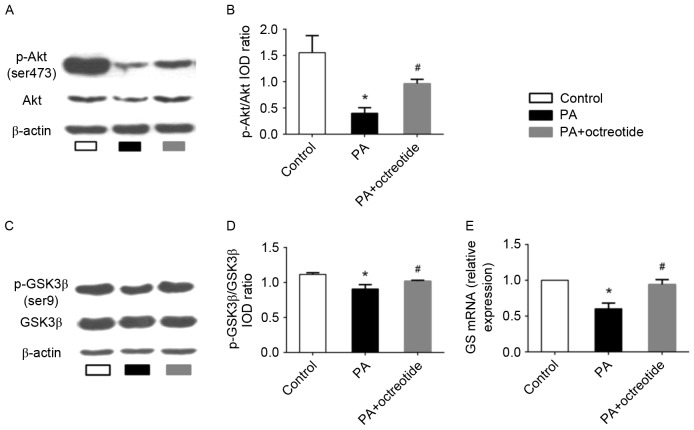
Figure 4.
Expression of p-Akt and p-GSK3β protein, and GS mRNA levels in PA-treated HepG2 cells. (A) Western blotting images of p-Akt (Ser473) expression, and (B) quantification of band intensities. The PA group exhibited the lowest protein expression levels of p-Akt among the three groups. (C) Western blotting images of p-GSK3β (Ser9) expression, and (D) quantification of band intensities. The level of p-GSK3β expression in the PA group was lower when compared with the control group. However, octreotide administration inhibited the reduction by promoting GSK3β phosphorylation. (E) The downregulation of GS mRNA in the PA group was ameliorated by octreotide intervention. Data are presented as the mean ± standard deviation of three independent experiments. *P<0.05 vs. the control group; #P<0.05 vs. the PA group. p-Akt, phosphorylated-Akt; p-GSK3β, phosphorylated-glycogen synthase kinase 3β; GS, glycogen synthase; PA, palmitate; HFD, high fat diet; IOD, integrated optical density.

