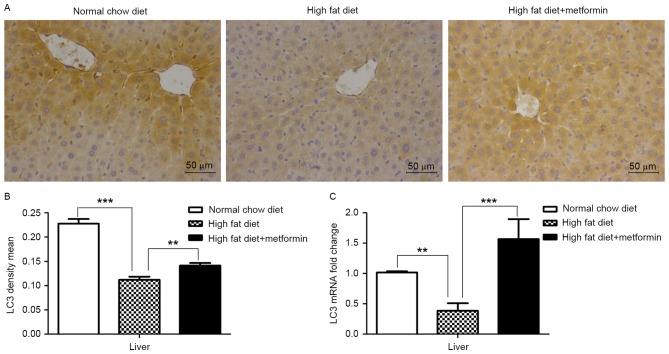
Figure 4.
Metformin treatment upregulates the expression of LC3 in the liver of HFD-induced obese mice. (A) Microphotographs of liver tissues from mice in the normal chow diet, high fat diet and high fat diet+metformin groups following immunohistochemical staining of LC3. (B) Quantitative analysis of LC3-positive regions in the liver tissue sections. (C) mRNA levels of LC3 in the liver, measured using reverse transcription-quantitative polymerase chain reaction analysis and normalized to glyceraldehyde-3-phosphate dehydrogenase. Data are presented as the mean ± standard error of the mean **P<0.01; ***P<0.001. LC3, microtubule-associated protein 1 light chain 3.

