
Figure 4.
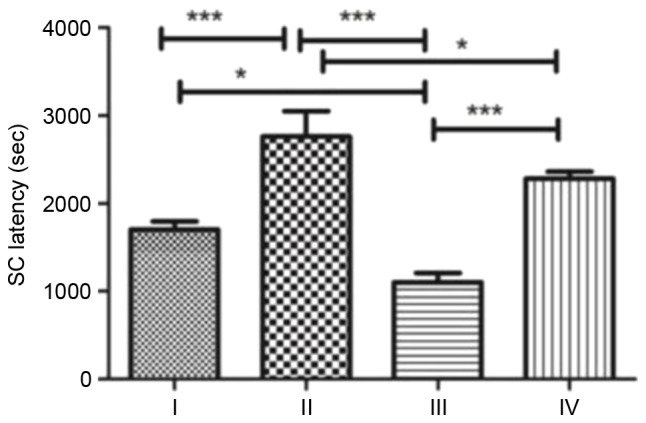
SC susceptibility. Data are presented as the mean ± standard deviation of the rats in each group. *P<0.05; ***P<0.001. SC, status convulsion.
Official websites use .gov
A
.gov website belongs to an official
government organization in the United States.
Secure .gov websites use HTTPS
A lock (
) or https:// means you've safely
connected to the .gov website. Share sensitive
information only on official, secure websites.
SC susceptibility. Data are presented as the mean ± standard deviation of the rats in each group. *P<0.05; ***P<0.001. SC, status convulsion.