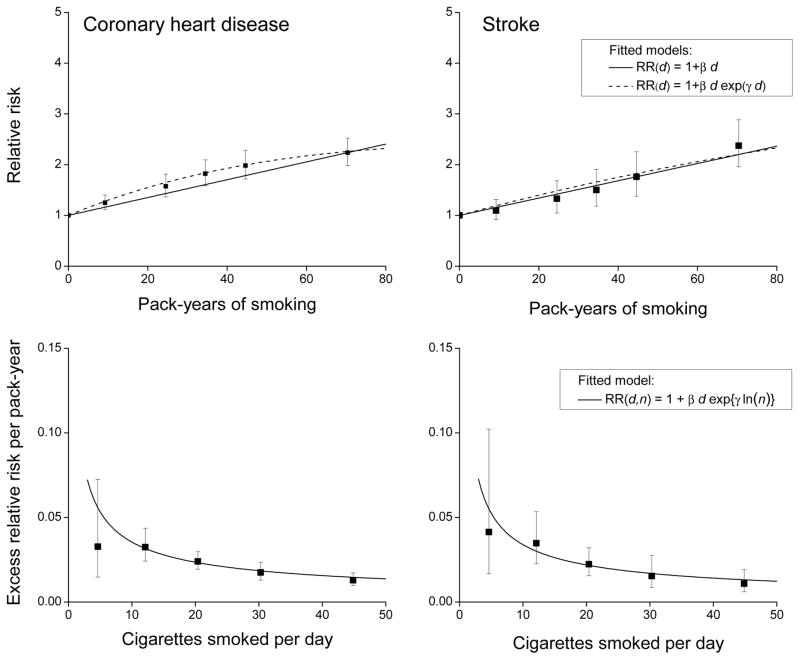
Figure 3.
For coronary heart disease (left panels) and stroke (right panels), relative risks for categories of pack-years of cigarette smoking (solid symbol) relative to never-smokers with fitted linear (solid line) and linear-exponential (dash line) model (upper panels) and estimated excess relative risk/pack-year within categories of cigarettes/day (solid symbol) and fitted models for continuous pack-years and cigarettes/day (solid line) (lower panels). All results adjusted for age, birth year, sex and other factors (see text).

