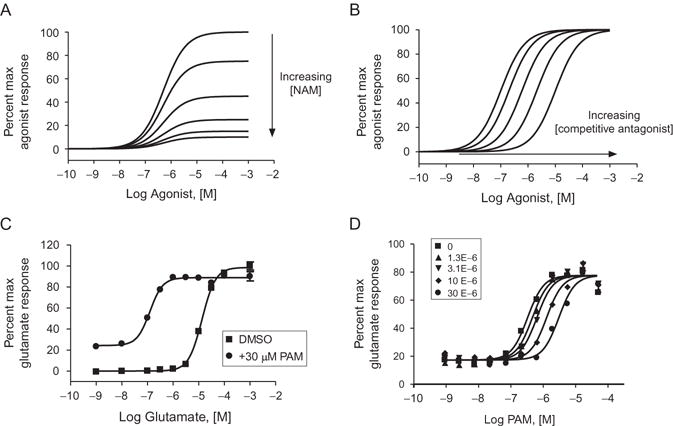
Figure 1.5.

Examples of allosteric modulator profiles and use of SAMs as tools to determine ligand binding sites. (A) Simulation of the right-shift and depression of the Emax that is observed when increasing concentrations of a high efficacy NAM are applied with an agonist CRC. Note that the effect is saturable. (B) In comparison, this panel shows a simulation of the behavior of an antagonist that is competitive with the agonist. Note that the effect of the antagonist is surmountable as demonstrated by the return to maximal response by the agonist. (C) Example of a baseline effect observed in a fold-shift assay by a PAM that imparts a response independent of orthosteric agonist (DMSO control CRC curve, squares; curve in the presence of an ago-PAM, circles; note the increase in the response in the presence of low concentration of agonist. C.M. Niswender, previously unpublished data). (D) The effect of increasing concentrations of a neutral allosteric ligand (5-MPEP) on a PAM (VU0404211) CRC in a Ca+2 assay. 5-MPEP is known to interact at the MPEP site on mGlu5 and may be used as a probe to determine if a PAM is competitive at the same site. Note the features of competitive behavior of the data that can be fit to the Gaddum/Schild equation to test this hypothesis (P.N. Vinson, previously unpublished data).
