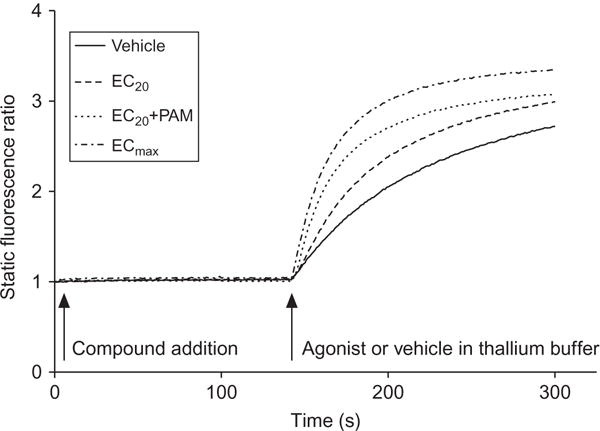
Figure 1.6.

Characteristic traces observed from a thallium flux experiment. Shown are data collected during a thallium flux assay in hM4 muscarinic receptor/GIRK-HEK cell line (P.N. Vinson, previously unpublished data). The M4 PAM, VU0152100, was added to cells that had been incubated with the dye FluoZin TM-2 AM followed by an EC20 concentration of acetylcholine in buffer containing thallium. The response is measured as the slope of the linear portion of the curve after thallium addition. The vehicle response can then be subtracted, followed by normalization to the baseline-corrected ECmax of agonist, to normalize across experiments.
