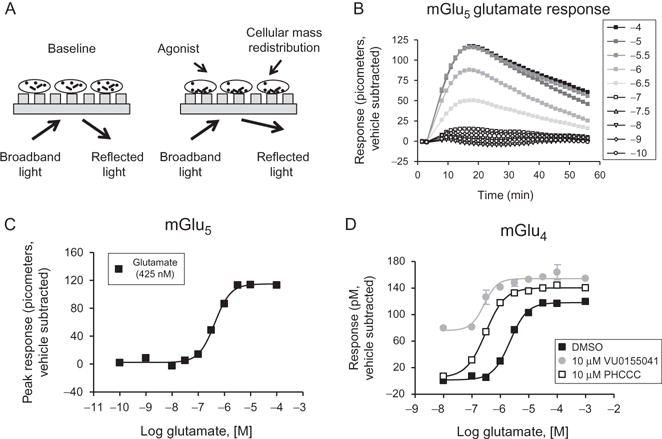
Figure 1.7.

Principle of Epic® technology and examples of glutamate receptor pharmacology assessed using this method. (A) Dynamic mass redistribution principle. Cells are plated onto plates containing a resonance waveguide grating. Broadband light is shone onto the bottom of the place and then reflected. After agonist treatment, mass distribution of intra-cellular components occurs,resulting in a shift in the wavelength of the reflected light measured in picometers. (B) Example Epic® traces observed after the application of the agonist glutamate to cells expressing mGlu5 after subtraction of vehicle responses. (C) The peak responses from panel (B) are plotted as a glutamate CRC. (D) Responses of glutamate alone and glutamate in the presence of two mGlu4 PAMs. In this case, PHCCC acts as a pure PAM, with no agonist activity as noted in other in vitro assays. In contrast, VU0155041 shows agonist activity in other in vitro settings (panel (C) of Fig. 1.5 shows data in the absence and presence of VU0155041 in a thallium flux assay); note the raised baseline in the Epic® data shown here. (C.M. Niswender, previously unpublished data).
