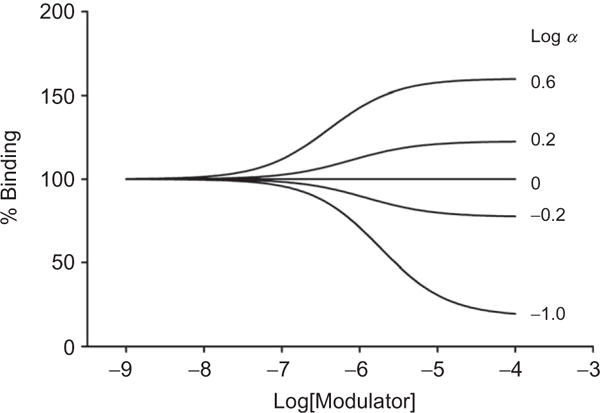
Figure 1.8.

Simulation of the effect of different values of the allosteric modulator affinity parameter, α, on the binding of orthosteric radioligand using the ATCM. For the simulation, radioligand concentration=radioligand KD=1 nM and modulator affinity (KB) = 10−6 M. Curves were generated with GraphPad Prism 5 using the preloaded allosteric modulator titration equation.
