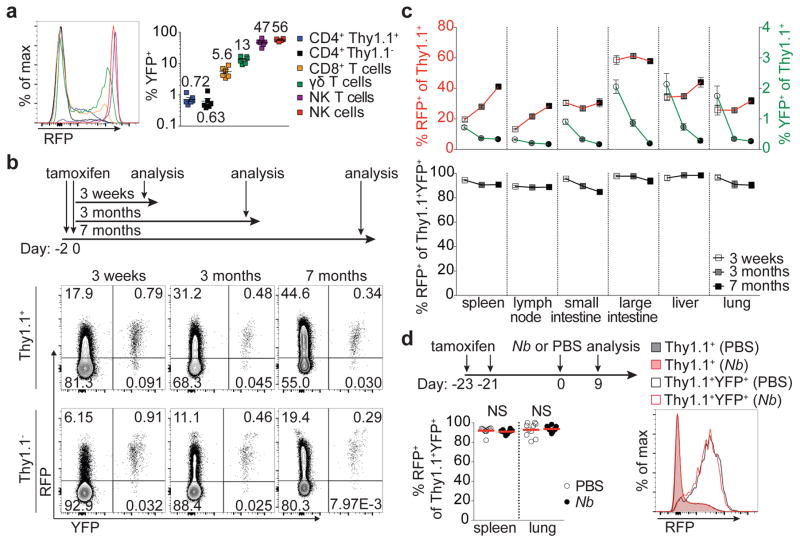
Figure 1. Stable T-bet expression in a subset of peripheral Treg cells.
a, Splenic cells inTbx21RFP-CreERT2 mice 3 weeks following tamoxifen (tx) gavage on days −2 and 0. Numbers on graph (right) indicate the mean. b, Schematic of tx administration to Tbx21RFP-CreERT2 mice (above) and flow cytometry (below) of splenic CD4 Thy1.1+ and Thy1.1− cells. c, (Above) RFP+ (left axis, squares) and YFP+ (right axis, circles) Treg cells; (below) Percent RFP+ of YFP+Treg cells 3 weeks (white symbols), 3 months (gray symbols), and 7 months (black symbols) post tx gavage. d, (Above) schematic of tx treatment with Nippostrongylus brasiliensis (Nb) infection; (below, left) percent RFP+ among YFP+ Treg cells in PBS- (white circles) and Nb- (black circles) challenged mice; (below, right) RFP expression in Treg (shaded histograms) or YFP+ Treg (open histograms) cells from spleens of PBS- (black) or Nb- (red) challenged mice. Bars, mean±s.e.m. Two-tailed t test (NS – not significant). All data are representative of 2 experiments, n ≥ 3 mice per group each.

