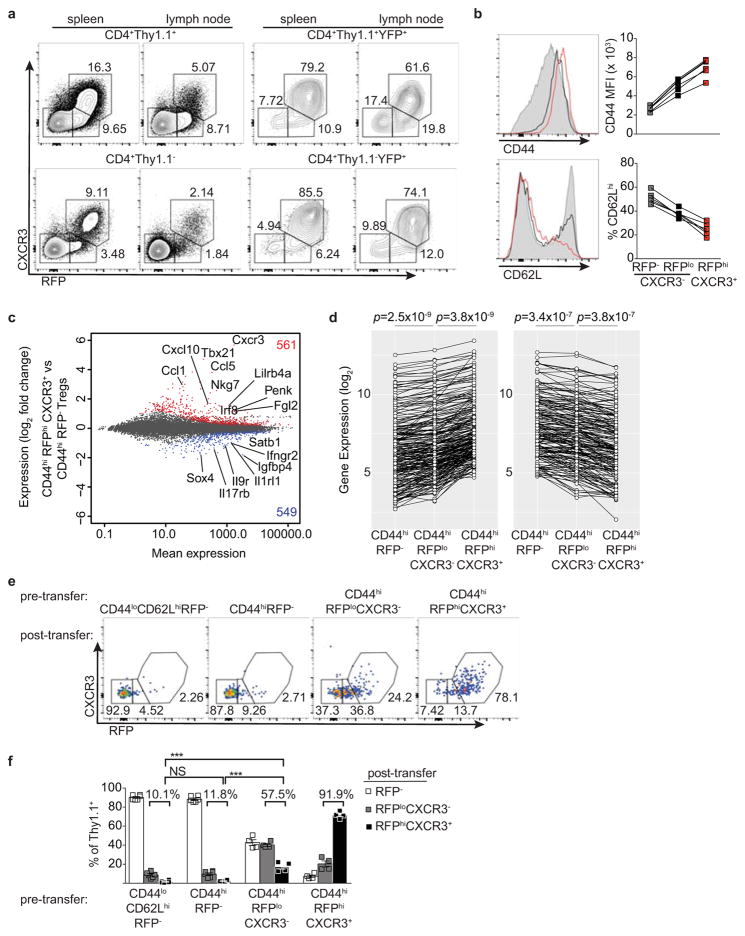
Extended Data Figure 3. Fate mapping T-bet-expressing Treg cells during infectious challenge.
a, Preferential expansion of CD44hiRFP− vs. CD44hiRFP+ CD4 effector T cells during Nippostrongylus brasiliensis (Nb) infection. Flow cytometry analysis of splenic (above) and lung (below) CD4+Thy1.1− cells from PBS- (left) and Nb- (right) challenged mice. b, Flow cytometry of splenic CD4+ Thy1.1+ (left) and Thy1.1− (right) cells of PBS- (above) and Lm- (below) challenged mice, as indicated in Fig 2a. Numbers indicate percent RFP+ (left) and YFP+ (right) cells. c, (Above) schematic of experiment. CD44loCD62LhiRFP−, CD44hiRFP−, and CD44hiRFPhiCXCR3hi CD4+Thy1.1+ cells were FACS-sorted from pooled spleens and lymph nodes of Tbx21RFP-CreERT2 mice and transferred into lymphoreplete hosts one day before PBS or Lm challenge. (Below) Flow cytometry of transferred populations (indicated on left) on d9 in spleens of PBS- (left) or Lm- (right) challenged hosts. d, Representative histograms of RFP and CXCR3 expression on total CD4+Thy1.1+ (shaded histograms) or Th1.1+YFP+ (open histograms) cells from spleens of PBS- (black) or Lm- (red) challenged mice, as indicted in Fig 2a. e–g, eGFP expression in PBS or Lm challenged Tbx21RFP-CreERT2IL-10eGFP mice. e, Schematic of tamoxifen (tx) administration to Tbx21RFP-CreERT2IL10eGFP/WT mice for data shown in (f,g). f, Flow cytometry of Treg (above) and YFP+ Treg (below) cells in spleens of PBS (left) and Lm (right) treated mice. g, (Left) percent RFP-eGFP+ and RFP+eGFP+ among Treg cells, as gated in (f, above); (right) percent eGFP+ cells among YFP+ Treg cells, as gated in (f, below). h, Schematic of Lm reinfection in Tbx21RFP-CreERT2IL10eGFP/WT mice for data shown in (i,j); 1o and 2o indicate primary and secondary challenge, respectively. i, Flow cytometry of cells in Tbx21RFP-CreERT2IL-10eGFP mice on d65, treated as indicated above. j, Percent RFP−eGFP+ and RFP+eGFP+ cells among Thy1.1+ cells, as gated in (i). All data are representative of ≥ 2 experiments, n≥ 2 mice per group each. Bars, mean±s.e.m. Two-tailed t test (NS – not significant).

