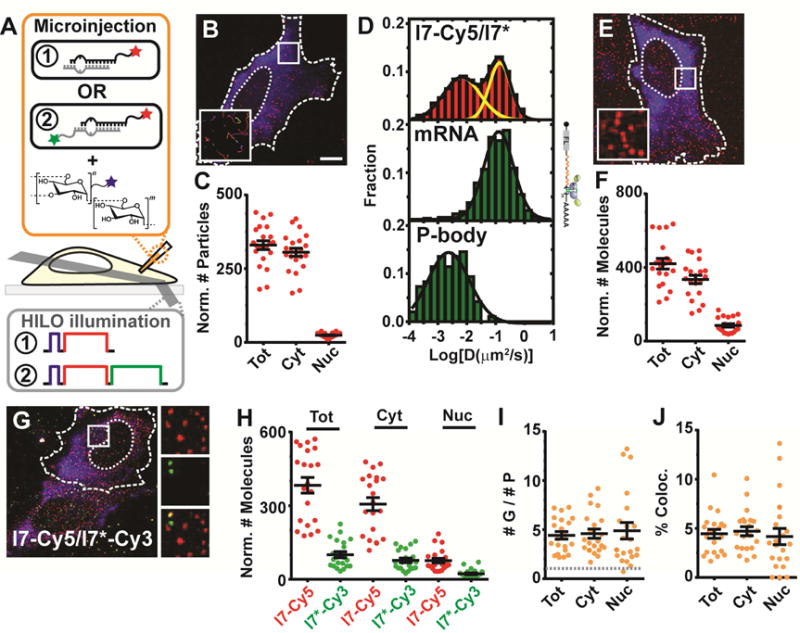
Figure 1. Outline of iSHiRLoC Data Acquisition and Analysis.

(A) Schematic of iSHiRLoC assays. Singly (red only, “1”) or doubly (red and green, “2”), 3′end labeled miRNAs and fluorophore labeled dextran (blue) are co-microinjected into cells and imaged by HILO microscopy. Dextran (blue, 1 s), Cy5 (red, 30 s) and Cy3 (green, 30 s) were excited one after another, as represented in the schematic of excitation pulses. (B) Representative image of a live U2OS cell containing stably assembled Cy5-labeled miRNA complexes as diffusing particles (red) and fluorescein-labeled, 500 kDa dextran (blue), 2 h after microinjection into the cytosol. Dotted and dashed lines represent nuclear and cellular boundaries respectively. Scale bar, 10 μm. Inset, 5.3 × 5.3 μm2 represents zoomed-in tracks of particles within white box. (C) Scatter plot depicting the total number of miRNA particles in the cell (“Tot”) or within the cytoplasmic (“Cyt”) or nuclear (“Nuc”) compartments. Error bars, SEM (n ≥ 3, # cells ≥ 18). Scale bars, labeling scheme and error bars are the same for other panels in this figure. (D) Diffusion coefficient distribution of l7-Cy5/l7* miRNAs, MCP-GFP labeled firefly luciferase (FL) mRNA with the mH3UM 3′UTR and GFP-Dcp1a punctate structures in U2OS cells. (E) Representative image of a formaldehyde-fixed U2OS cell containing individual Cy5-labeled miRNA particles (red), a majority of which are individual molecules, and fluorescein-labeled, 500 kDa dextran (blue). Inset represents zoomed-in view of particles within white box. (F) Scatter plot depicting the number of miRNA molecules. (G) Representative image of formaldehyde-fixed U2OS cells containing individual particles l7-Cy5 and l7*-Cy3, and Alexa-405-labeled, 500 kDa dextran (blue). Insets represent zoomed-in view of red (top), green (middle) and co-localized (bottom) particles within white box. (H) Scatter plot depicting the number of guide (G) and passenger (P) strand molecules. (I) Scatter plot representing the ratio of guide to passenger strand. Grey line represents a 1:1 ratio of G:P. Scale bars, labeling scheme and error bars as in (C). (J) Scatter plot representing the percentage of co-localized molecules, as normalized to the more abundant guide strand molecules.
