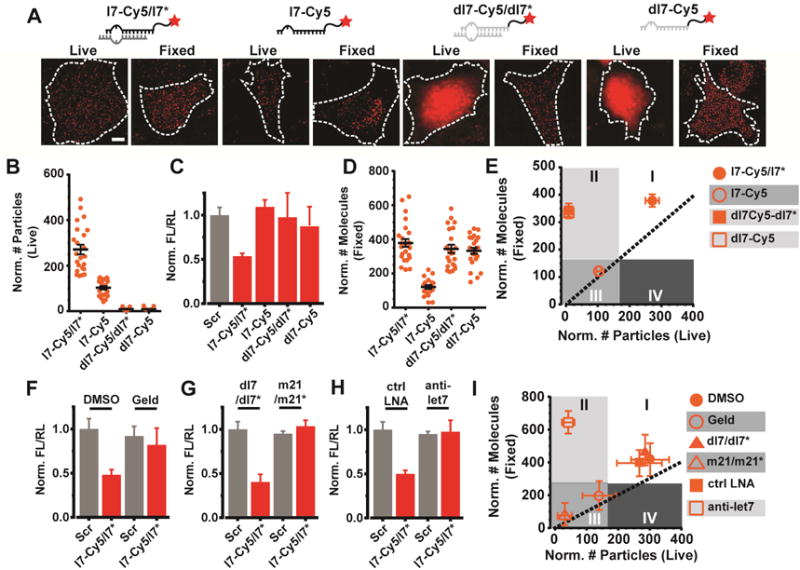
Figure 2. Validation of the correlative counting analysis (CCA).

(A) Representative images of live and fixed U2OS cells injected with various Cy5-labeled oligonucleotides (red) bearing the sequence of let-7 miRNA. Scale bar, 10 μm. Images were acquired 2 h after microinjection. (B) Scatter plot depicting the total number of particles for each “Live” sample in (A). Error bars, SEM (n ≥ 2, # cells ≥ 20). (C) Luciferase reporter assays of U2OS cells transfected with the pmG-mH3U plasmid and the appropriate oligonucleotide. Error bars, SEM (n = 3, with 4 technical replicates per trail). (C) Scatter plot depicting the total number of molecules for each “Fixed” sample in (A). Error bars, SEM (n ≥ 2, # cells ≥ 20). (E) Plot correlating the abundance of particles in live and fixed cells. Dotted line represents a perfect correlation. Each data point depicts the mean value and error bars depict SEM. Shaded regions were arbitrarily chosen. (F–H) Luciferase reporter assays of U2OS cells transfected with the pmG-mH3U plasmid and either a scrambled double stranded oligonucleotide (Scr) or l7-Cy5/l7* under various treatment conditions. Error bars, SEM (n = 3, with 4 technical replicates per trail). For inhibiting RISC loading (F), cells were treated with Geld and compared to control cells treated with DMSO (ctrl). For competitive inhibition experiments (G), cells were treated with a 5-fold excess of unlabeled miR21 (m21/m21*) or equivalent amount of dl7/dl7*. For blocking target binding (H), cells were treated with a 3-fold excess of anti-let7 anti-miR (LNA) or control anti-miR (ctrl LNA) bearing no complementarity to let7. (I) Plot correlating the abundance of particles in live and fixed cells, as plotted in (E).
