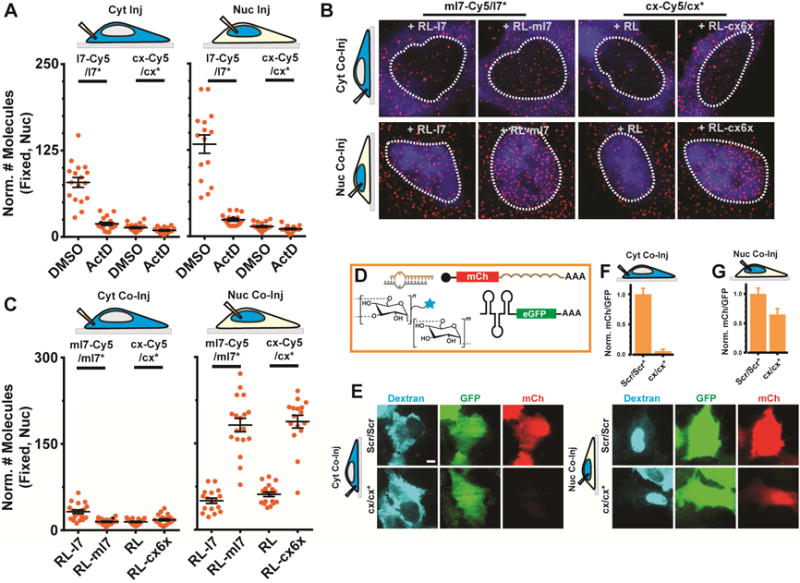
Figure 6. Seed-matched targets mediate nuclear localization of miRNAs.

(A) Scatter plot representing the number of l7-Cy5/l7* or cx/cx* miRNA molecules in the nucleus of DMSO or ActD treated cells (n ≥ 2, ≥ 10 cells). Samples were injected into the cytosol (left) or nucleus (right) of U2OS cells and imaged 2 h after microinjection. (B) Representative, pseudocolored images of U2OS cells injected in the cytoplasm (top) or nucleus (bottom) with FITC labeled 500 kDa dextran (blue), guide strand labeled miRNA (ml7-Cy5/ml7* or cx-Cy5/cx*, Cy5 – red) and unlabeled mRNA (RL-l7, RL-ml7, RL-cx6x or RL). Scale bar, 5 μm. (C) Scatter plot depicting the quantifications of samples represented in (B) (n ≥ 2, ≥ 15 cells). (D) Top (left), schematic of assay. (E) Representative images of Dextran (blue), GFP (green) and mCherry (mCh, red) fluorescence in cells coinjected with a scrambled control RNA (Scr/Scr*) or cx/cx* in the cytosol (left panels) or nucleus (right panels) are shown. Scale bar, 10 μm. (F) Quantifications of mCh fluorescence relative to GFP fluorescence for each sample is shown in (E). Error bars, SEM.
