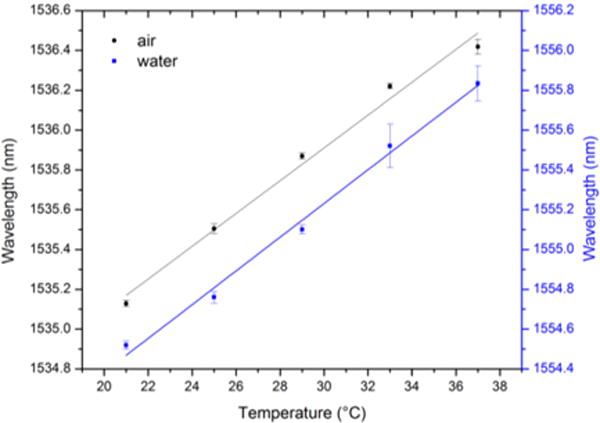
Fig. 2. Temperature sensitivity of optical resonance.

The wavelength of optical resonance (for a large-hole defect centered 4 rows from the W1 waveguide) was measured at 5 temperatures, ranging from room to physiological temperatures, under cover of both air and water. Resonant wavelength values were determined by Lorentzian fit; the mean resonant wavelength is plotted (n=5) and the error bars indicate the standard deviation of the mean. Linear fits were applied to quantify the temperature sensitivity, which was 0.08 nm/°C for both cover media (R2 > 0.99).
