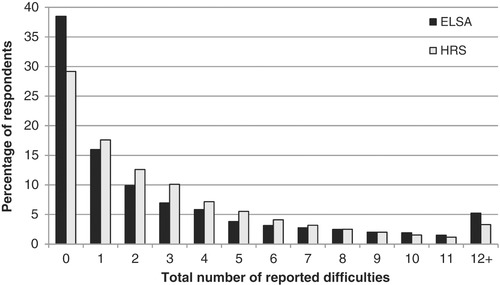
Figure 1.

Distribution of disabilities in England and the US
Note: Sample is core respondents aged 55–84 interviewed in 2002–03. Unweighted. See Table A.1 in the online appendix for a list of activities included in the disability index.

Distribution of disabilities in England and the US
Note: Sample is core respondents aged 55–84 interviewed in 2002–03. Unweighted. See Table A.1 in the online appendix for a list of activities included in the disability index.