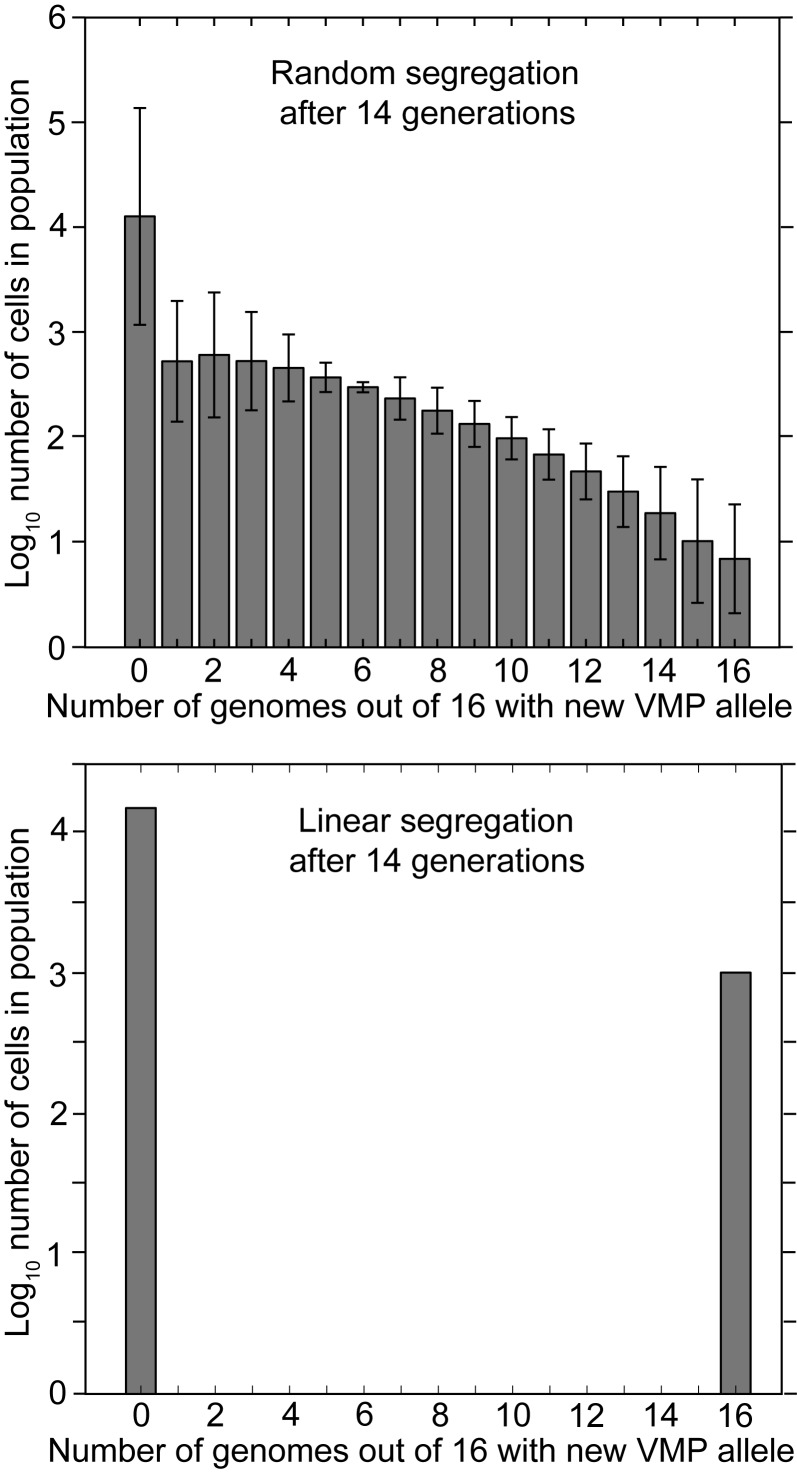
Figure 4.
Frequency distributions of the number of cells with different proportions of genomes with a switched VMP gene in descendent populations 14 generations after the genetic switch in the ancestor. The cells in these populations have 16 genomes. The top panel shows the results under the condition of random segregation of genomes. The bottom panel shows the results under the condition of linear segregation. Error bars denote the standard errors.

