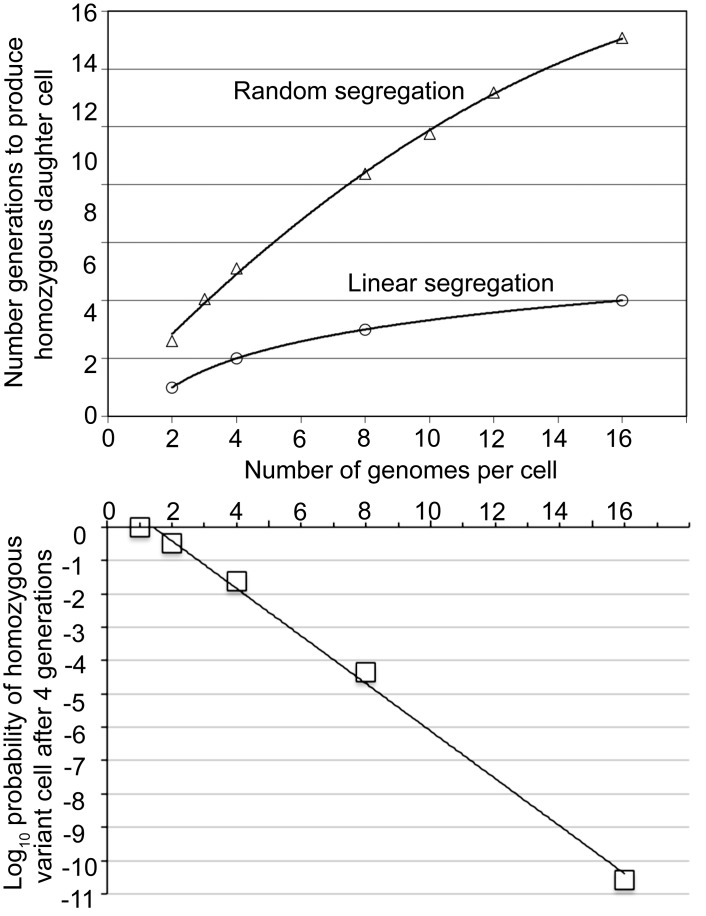
Figure 5.
Differences in outcomes in the generations until homozygosity for a switch gene is achieved under the random segregation and linear segregation models. The top panel gives the number of generations by number of genomes per cell. For the random segregation condition the plotted values are means calculated from a hypergeometric distribution. The best-fit curve (R2 = 0.998) is a second-order quadratic polynomial. For the linear segregation model the values are exact for genomes numbering 2n, where n is an integer ranging from 0 to 4. The best-fit curve (R2 = 1.0) is a logarithmic function. The bottom panel gives probability of a homozygous variant cell after four generations by the number of genomes per cell and when there is random segregation.

