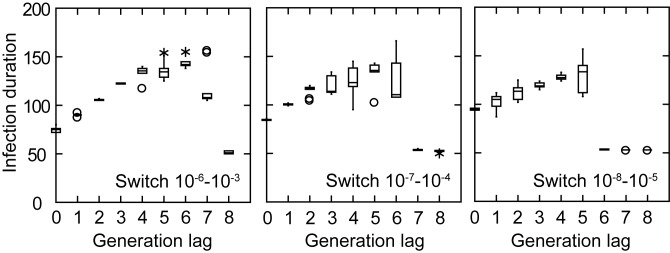
Figure 7.
Box whisker plots of durations in arbitrary time units of infection by different generation lags in achievement of homozygosity for a switched gene in simulations that incorporate parameters for the host antibody response (see text). Matrices of evolved switch rates were in the ranges of 10-6 to 10-3, 10-7 to 10-4, and 10-8 to 10-5 per genome per generation. There were 300 time steps, each step being 0.1 in arbitrary time units. Serotype-specific antibody appeared and began to accumulate once there were at least 100 cells and at doubling rate equal to the doubling rate for the bacteria. The antibody synergy parameter (b) was 0.5. The antibody loss rate was 0.001. The carrying capacity, i.e. the maximum cell density, was 107 cells per milliliter. The death rate constant for the bacteria once serotype-specific antibody appeared was 0.001. For each condition there were a 1000 runs and in 5 or 10 replicates. If the coefficient of variation was >0.05 after 5 replicates, another 5 replicates of 1000 runs were carried out.

