Figure 1.
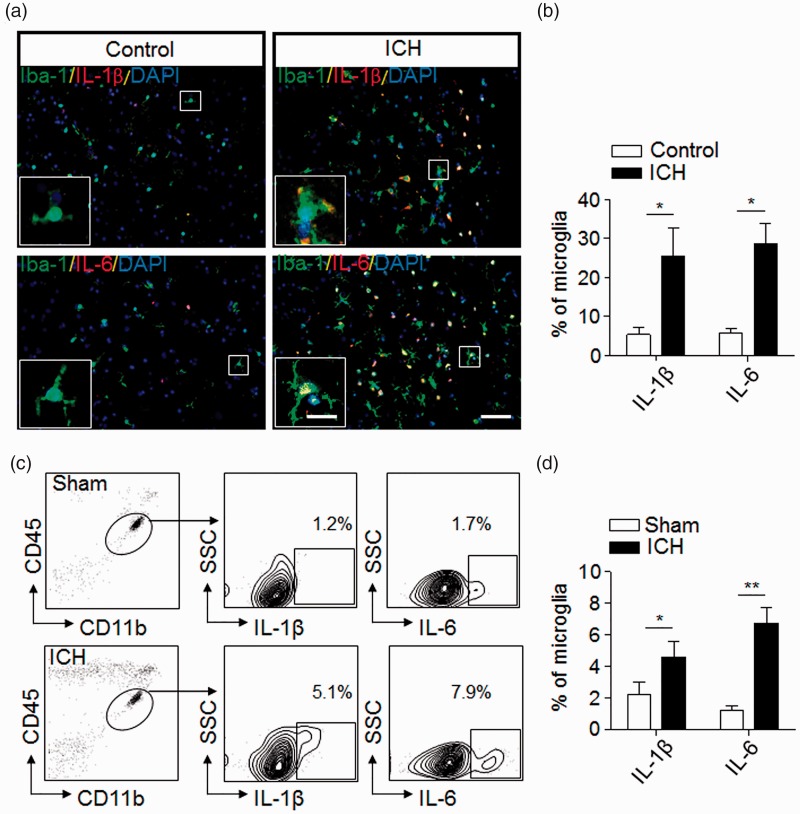
Microglial activation and production of inflammation mediators after ICH. (a) Immunostaining of brain sections from ICH patients or non-neurological disease controls shows Iba-1+ cells (green) expressing interleukin-1 beta (IL-1β) (red) and IL-6 (red). Scale bar: 50 µm; insert: 20 µm. (b) Quantification of microglia expressing IL-1β and IL-6 in the brain section from non-neurological disease controls and patients with ICH. n = 20 sections from five ICH patients, n = 15 sections from three non-neurological controls in three independent experiments. Mean ± s.e.m. *p < 0.05. (c,d) Expression of IL-1β and IL-6 in microglia (CD11b+CD45int) from sham control and ICH mice induced by injection of collagenase (0.0375U). Single cell suspensions were prepared from mouse brain tissues at 24 h after ICH or sham procedures. ICH was induced by collagenase injection. Quantification of microglia expressing IL-1β or IL-6 were determined by flow cytometry (c). Summarized results from three independent experiments are shown in (d). Mean ± s.e.m. n = 6 mice per group, *p < 0.05; **p < 0.01.

